Browser DevTools Tutorial Debug & Optimize Like a Pro
Introduction
Modern web development is not just about writing code—it’s about understanding how your code behaves in the browser. This is where browser developer tools (DevTools) come in. In this browser devtools tutorial: debug & optimize like a pro, you’ll learn how to use Chrome DevTools to inspect, debug, and optimize your websites like a professional developer.
For Pakistani students learning web development—whether you’re in Lahore, Karachi, or Islamabad—DevTools is one of the most important skills you can master. It helps you:
- Debug JavaScript errors quickly
- Improve website performance (important for users on slower internet connections)
- Understand how websites actually work behind the scenes
- Save time during development
Imagine Ahmad building an e-commerce site priced in PKR. If the checkout button doesn’t work, DevTools can help him identify the issue within minutes instead of hours.
Prerequisites
Before starting this tutorial, you should have basic knowledge of:
- HTML (tags, structure)
- CSS (selectors, styling)
- JavaScript basics (variables, functions, events)
- A modern browser (Google Chrome recommended)
Optional but helpful:
- Basic understanding of how websites load (requests & responses)
Core Concepts & Explanation
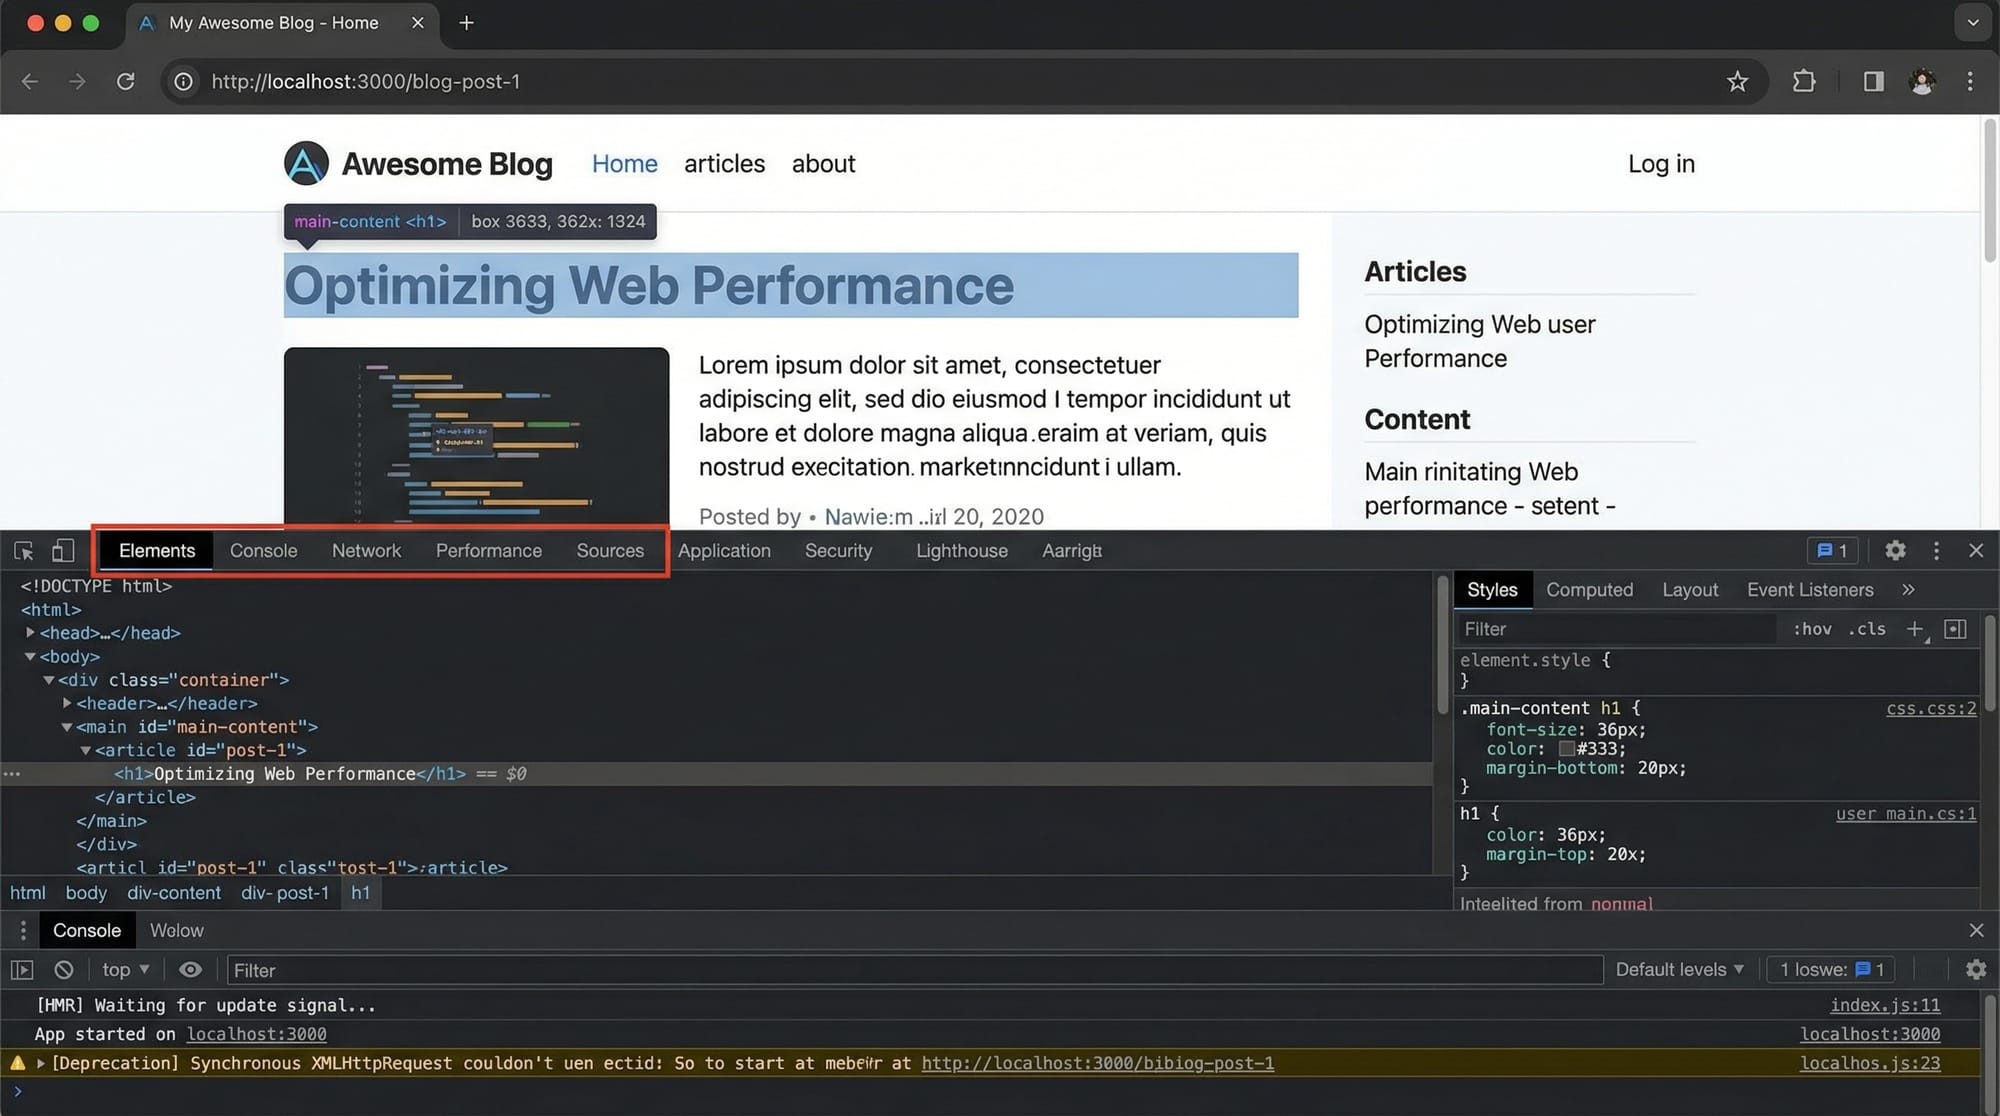
Understanding Chrome DevTools Panels
Chrome DevTools is a collection of tools built directly into the browser. You can open it by pressing:
Ctrl + Shift + I
Main panels include:
- Elements → Inspect HTML & CSS
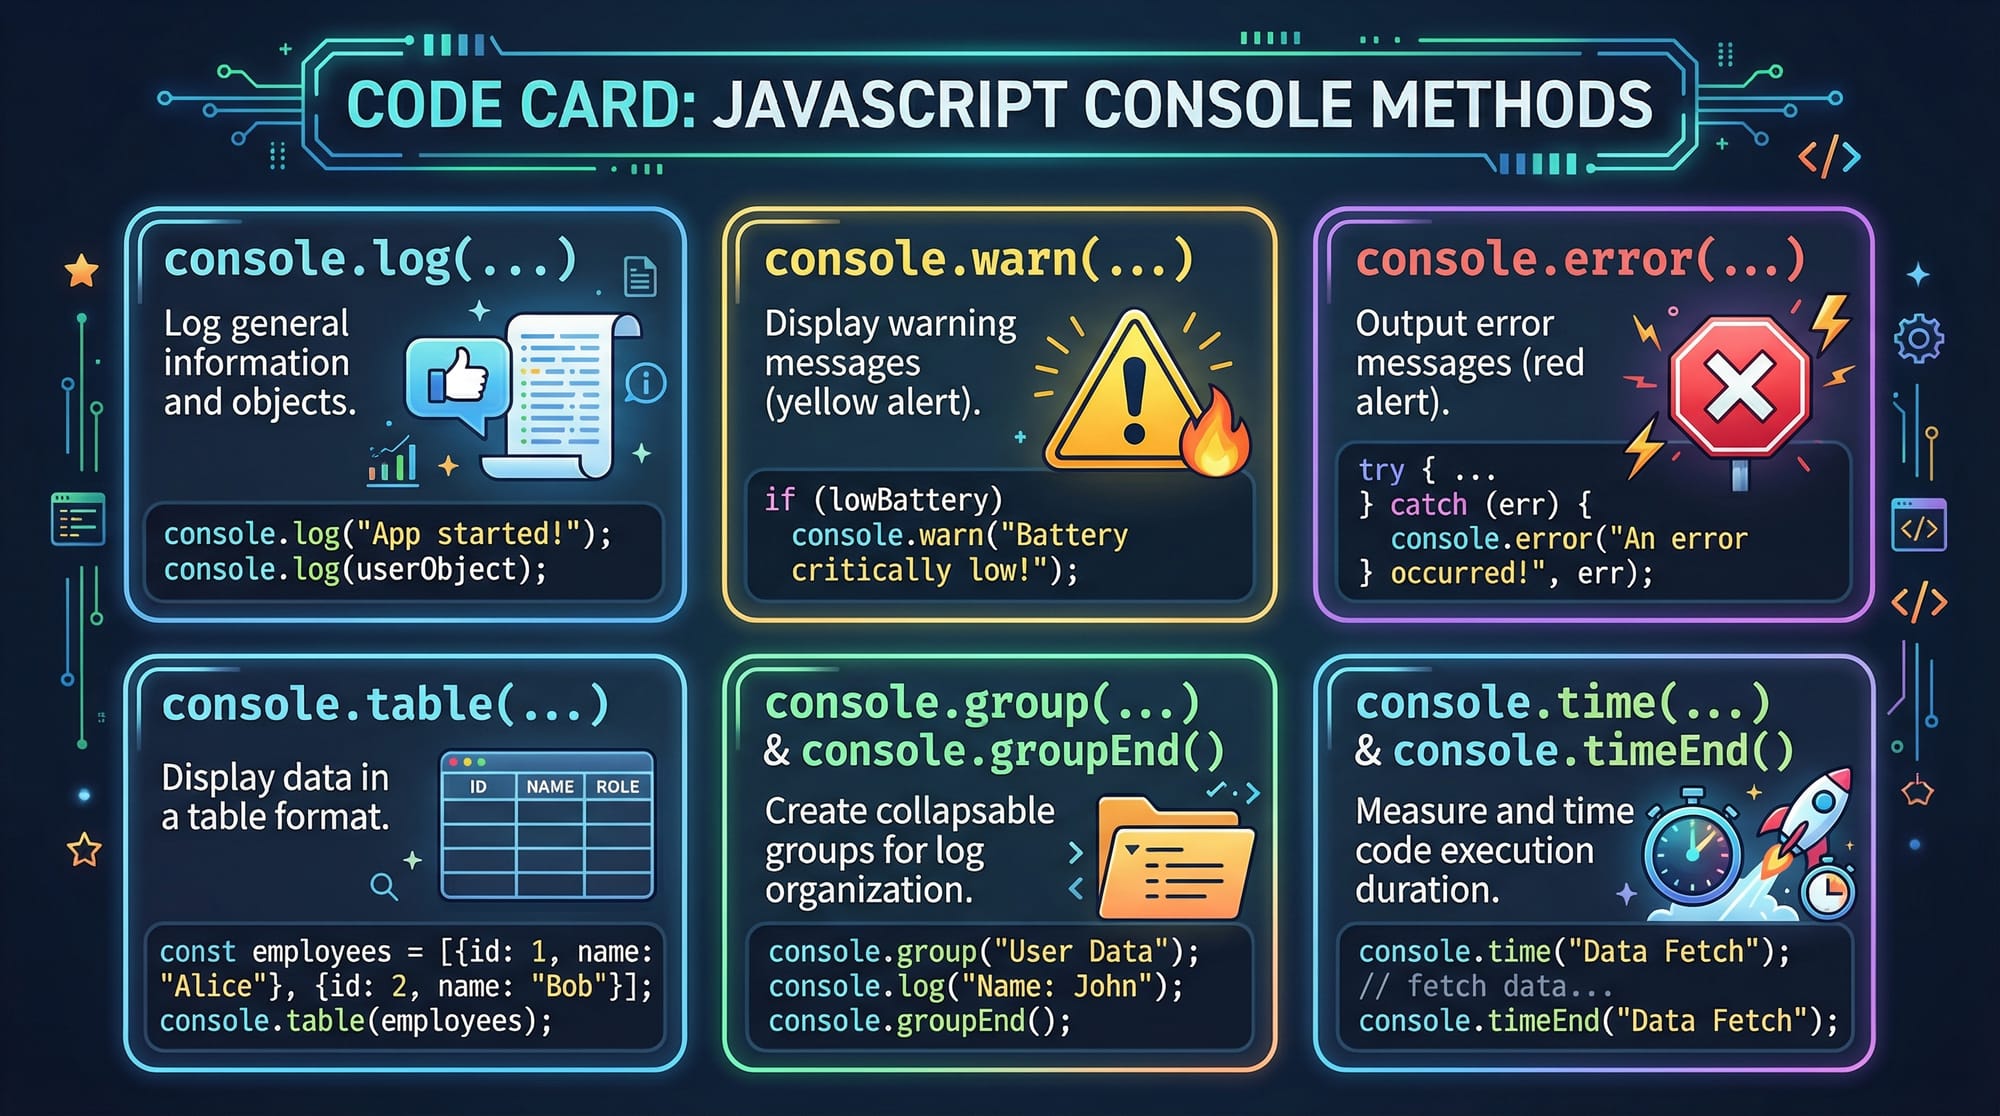
- Console → Run JavaScript & view logs
- Sources → Debug JavaScript
- Network → Monitor requests
- Performance → Analyze speed
Example
If Fatima notices her website layout is broken:
- Open DevTools
- Go to Elements panel
- Inspect the HTML element
- Modify CSS live
This helps her fix layout issues instantly without editing files first.
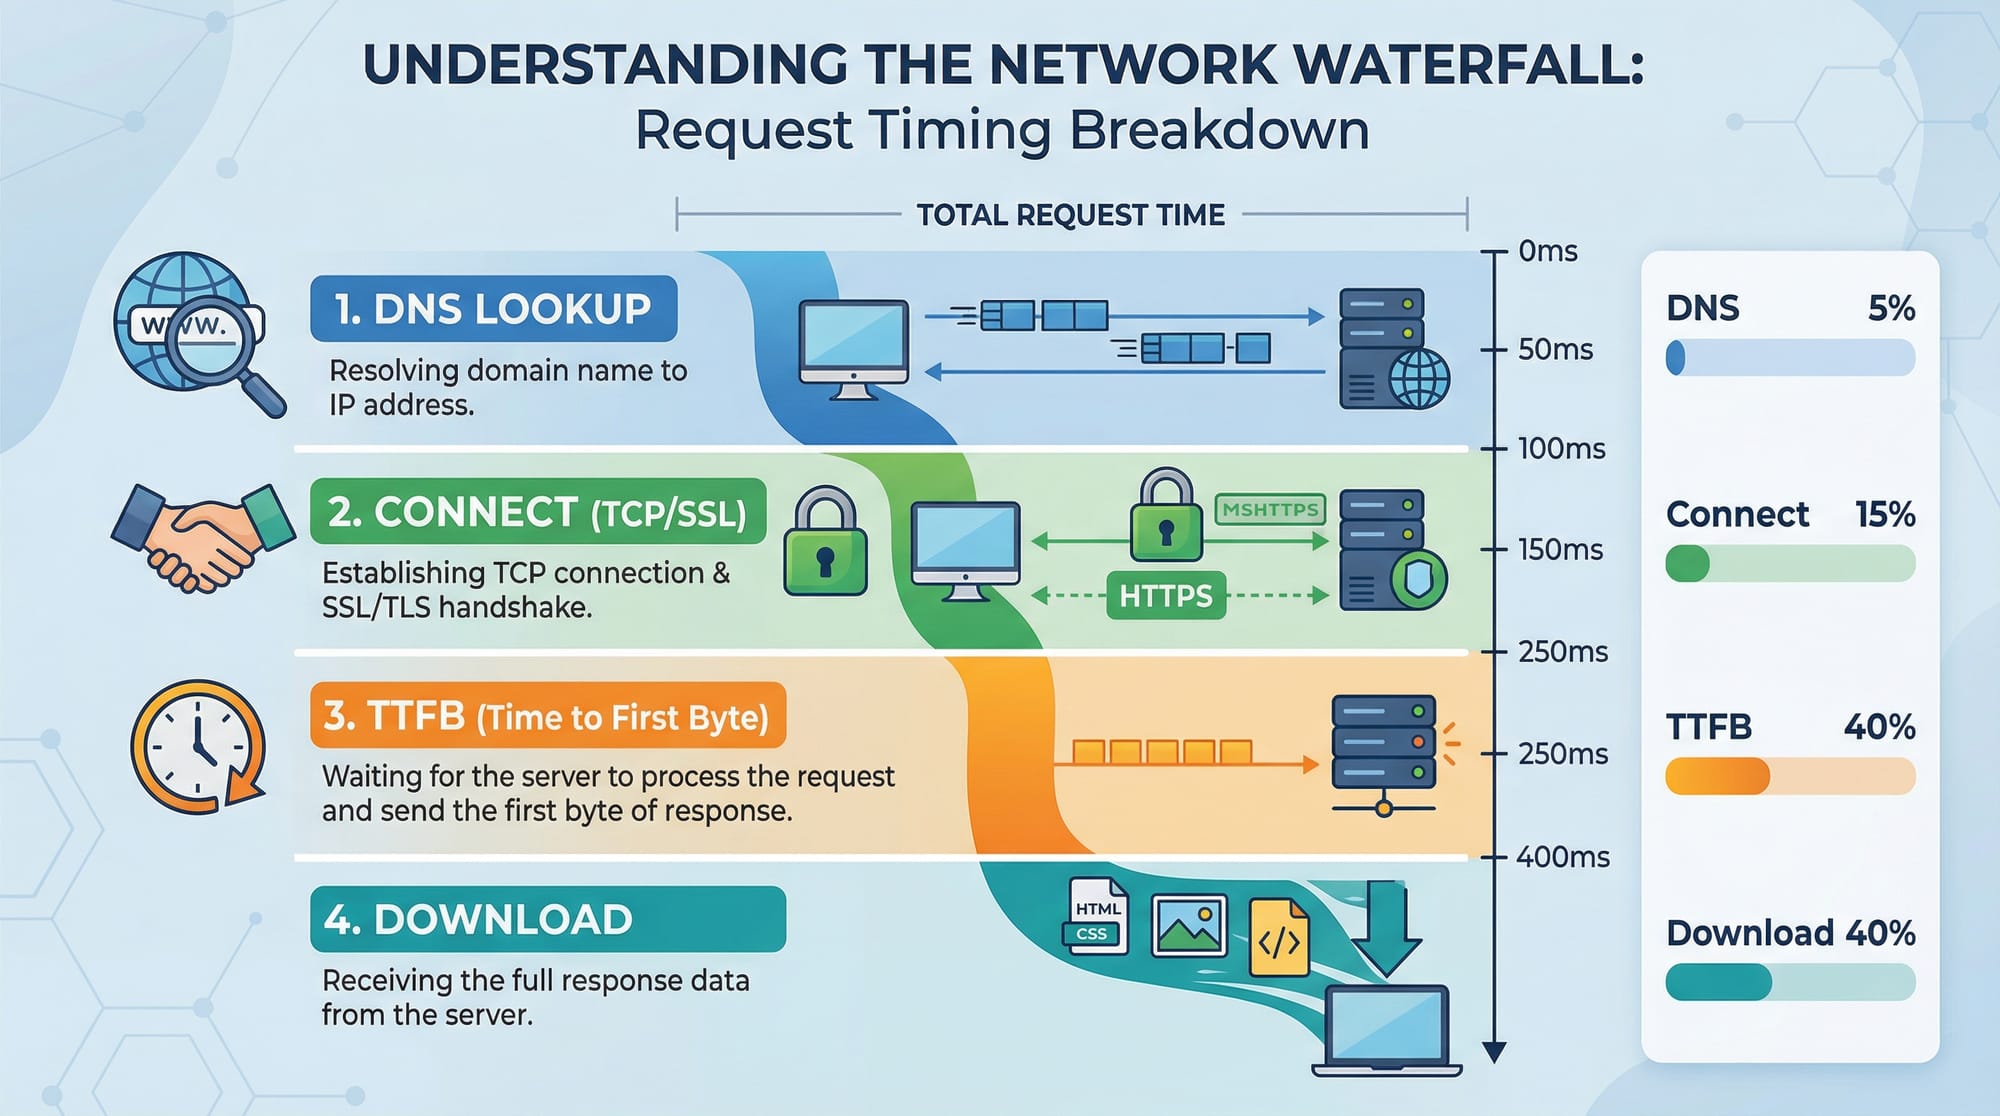
Network Analysis & Performance Optimization
The Network panel shows how your website loads resources like:
- HTML
- CSS
- JavaScript
- Images
Each request shows:
- Status (200, 404, etc.)
- Time taken
- File size
Example
Ali builds a blog in Islamabad, but it loads slowly. Using the Network panel, he discovers:
- Large images (2MB each)
- Slow API response
Solution:
- Compress images
- Optimize backend
Practical Code Examples
Example 1: Debugging JavaScript Errors with Console
// Line 1
let price = 500;

// Line 2
let discount = 50;

// Line 3
let finalPrice = price - discount;

// Line 4
console.log("Final Price:", finalPrice);

// Line 5
console.log(totalPrice); // Error here
Explanation
- Line 1: Declares variable
pricewith value 500 - Line 2: Declares
discount - Line 3: Calculates final price
- Line 4: Logs correct value
- Line 5: Uses undefined variable
totalPrice→ causes error
Debugging Steps
- Open Console panel
- See error:
ReferenceError: totalPrice is not defined - Fix variable name:
console.log(finalPrice);
Example 2: Real-World Application (Form Validation)
// Line 1
document.querySelector("#form").addEventListener("submit", function(e) {

// Line 2
  e.preventDefault();

// Line 3
  let name = document.querySelector("#name").value;

// Line 4
  if (name === "") {

// Line 5
    console.warn("Name is required");

// Line 6
  } else {

// Line 7
    console.log("Form submitted successfully");

// Line 8
  }

// Line 9
});
Explanation
- Line 1: Selects form and adds submit event
- Line 2: Prevents page reload
- Line 3: Gets input value
- Line 4: Checks if empty
- Line 5: Shows warning in console
- Line 6-8: Logs success message
- Line 9: Ends function
This is useful for real-world Pakistani projects like student registration forms.
Common Mistakes & How to Avoid Them
Mistake 1: Ignoring Console Errors
Many beginners ignore red errors in the console.
Problem
console.log(userName);
Error: userName is not defined
Fix
Always define variables:
let userName = "Ali";
console.log(userName);
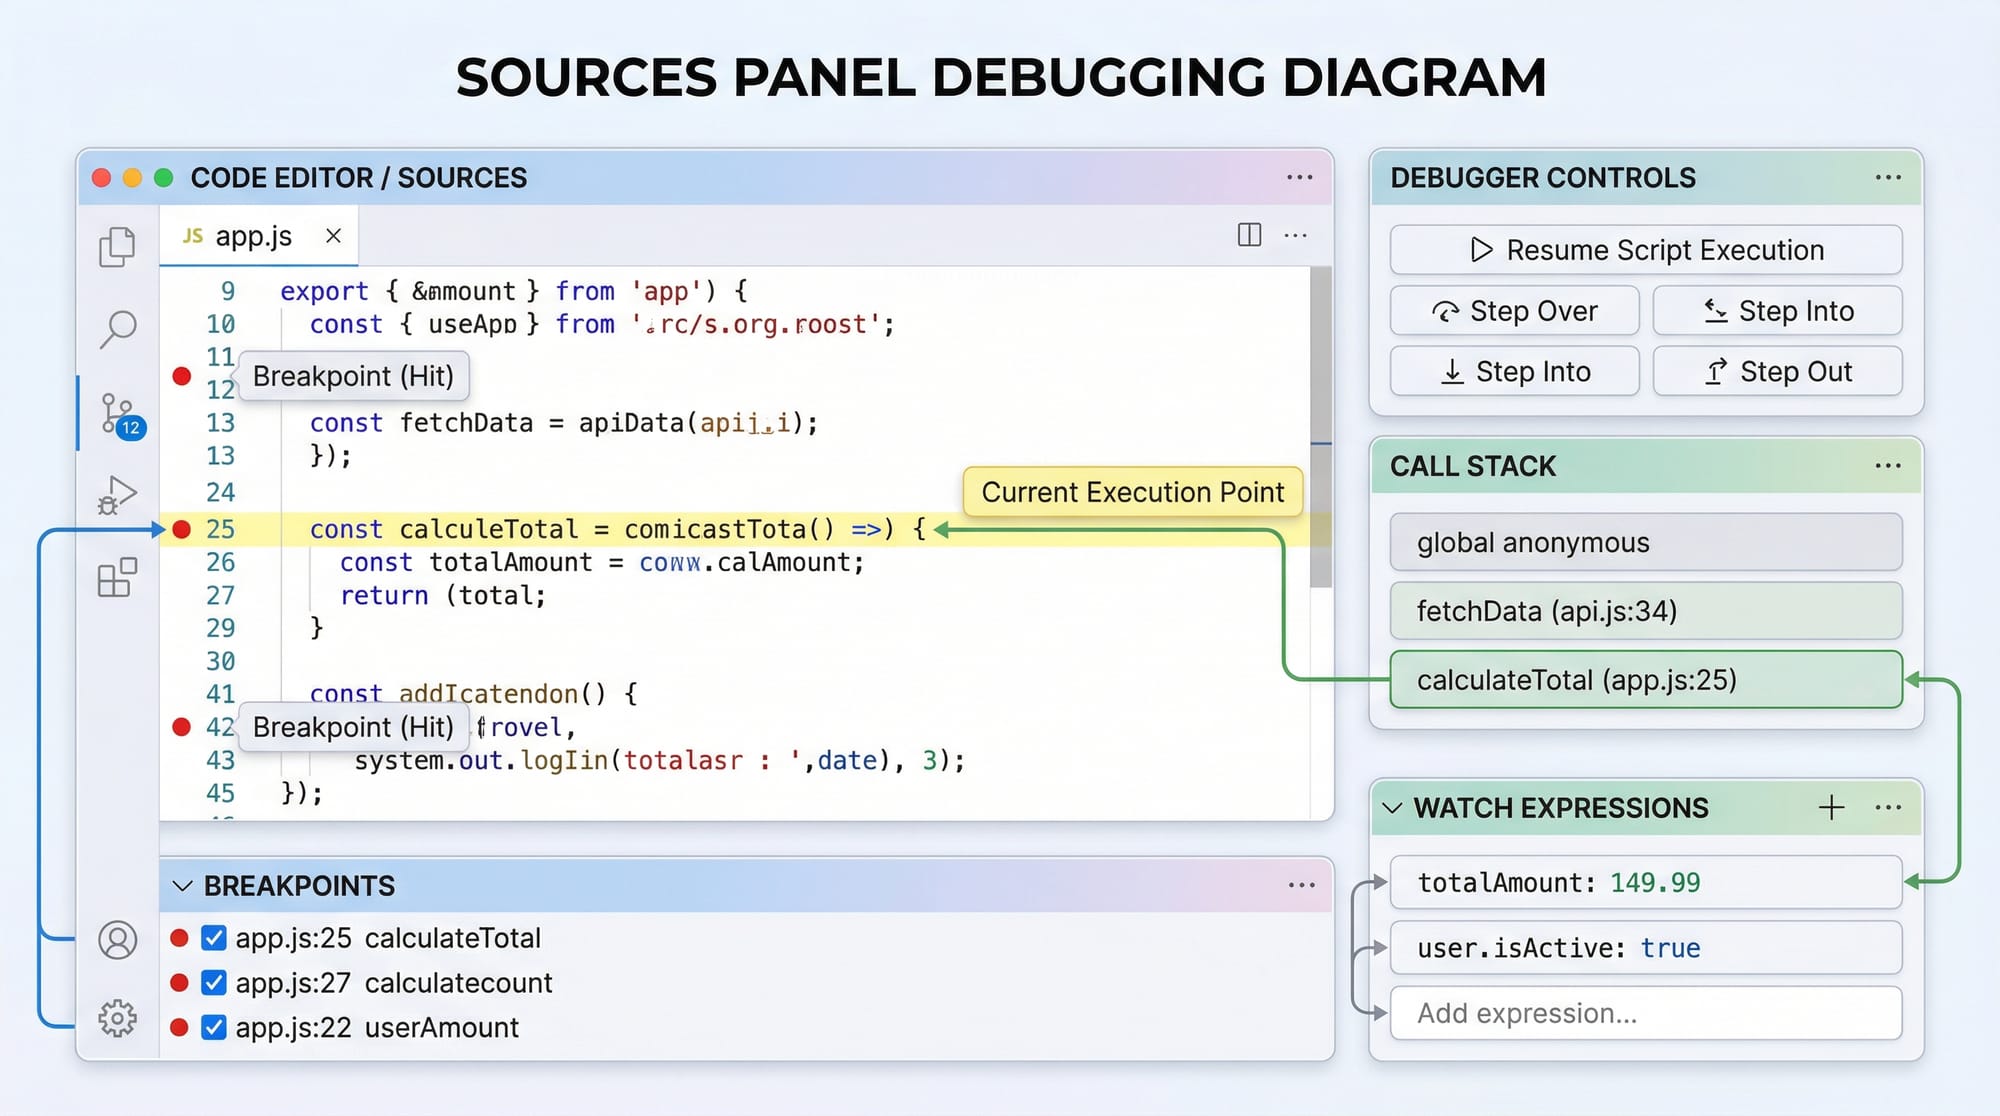
Mistake 2: Not Using Breakpoints
Breakpoints allow you to pause code execution.
Problem
Developers use only console.log() instead of debugging properly.
Fix
- Open Sources panel
- Click line number → breakpoint added
- Refresh page
- Code pauses → inspect variables
Practice Exercises
Exercise 1: Fix Console Error
Problem
let total = 1000;
console.log(totl);
Solution
let total = 1000;
console.log(total);
Explanation: Typo caused error. DevTools console helps identify it instantly.
Exercise 2: Debug Button Click
Problem
document.querySelector("#btn").onclick = function() {
  console.log("Clicked");
}
Button not working.
Solution
document.querySelector("#btn").addEventListener("click", function() {
  console.log("Clicked");
});
Explanation: Use addEventListener for better reliability and debugging.
Frequently Asked Questions
What is browser DevTools?
Browser DevTools is a set of built-in tools in browsers like Chrome that help developers inspect, debug, and optimize websites. It allows you to view HTML, CSS, JavaScript, and network activity.
How do I open Chrome DevTools?
You can open it by pressing Ctrl + Shift + I or right-clicking on a webpage and selecting Inspect. It works on Windows, macOS, and Linux.
How do I debug JavaScript using DevTools?
Use the Console panel for errors and the Sources panel for breakpoints. Breakpoints pause execution so you can inspect variables step by step.
Why is my website slow?
Use the Network and Performance panels to identify slow resources. Common causes include large images, unoptimized scripts, and slow APIs.
Can I edit code directly in DevTools?
Yes, you can temporarily edit HTML, CSS, and JavaScript directly in DevTools. However, changes are not permanent unless you update your actual files.
Summary & Key Takeaways
- DevTools is essential for debugging and optimizing websites
- Console helps quickly identify JavaScript errors
- Elements panel allows real-time HTML/CSS editing
- Network panel shows loading performance
- Breakpoints make debugging easier than console logs
- Practicing with real-world scenarios improves skills
Next Steps & Related Tutorials
To continue your learning journey on theiqra.edu.pk, explore:
- Learn JavaScript fundamentals in our JavaScript Tutorial
- Improve website speed with our Web Performance Optimization Guide
- Understand layouts in our CSS Flexbox & Grid Tutorial
- Build real projects in our Frontend Development Guide
By combining these skills with DevTools, you’ll be able to debug and optimize like a true professional developer 🚀
Test Your Python Knowledge!
Finished reading? Take a quick quiz to see how much you've learned from this tutorial.