Polars Tutorial Fast DataFrame Library for Python 2026
Python’s data ecosystem is evolving rapidly. While Pandas has been the go-to library for data manipulation, Polars has emerged as a modern, high-performance alternative that handles large datasets efficiently. In this tutorial, we’ll explore Polars for Python, understand its advantages, and learn how it can speed up data analysis tasks — especially useful for Pakistani students dealing with real-world data in finance, education, or research.
Polars is designed for speed, memory efficiency, and parallel execution, making it ideal for handling datasets like PKR stock prices, Lahore weather data, or university student records. By learning Polars, you’ll gain an edge in data science, analytics, and Python programming in 2026.
Prerequisites
Before diving into Polars, you should have:
- Basic Python programming knowledge (variables, loops, functions)
- Familiarity with Pandas (optional but helpful for comparison)
- Understanding of CSV, Excel, or JSON files
- Python environment setup with
pipand Jupyter Notebook or VS Code
You should also be comfortable with basic data analysis concepts, such as filtering, grouping, and aggregating data.
Core Concepts & Explanation
Polars DataFrames: Lightweight & Fast
Polars uses Arrow memory format, which allows efficient storage and processing of data. Unlike Pandas, Polars performs operations in a lazy, parallelized manner when using lazy execution.
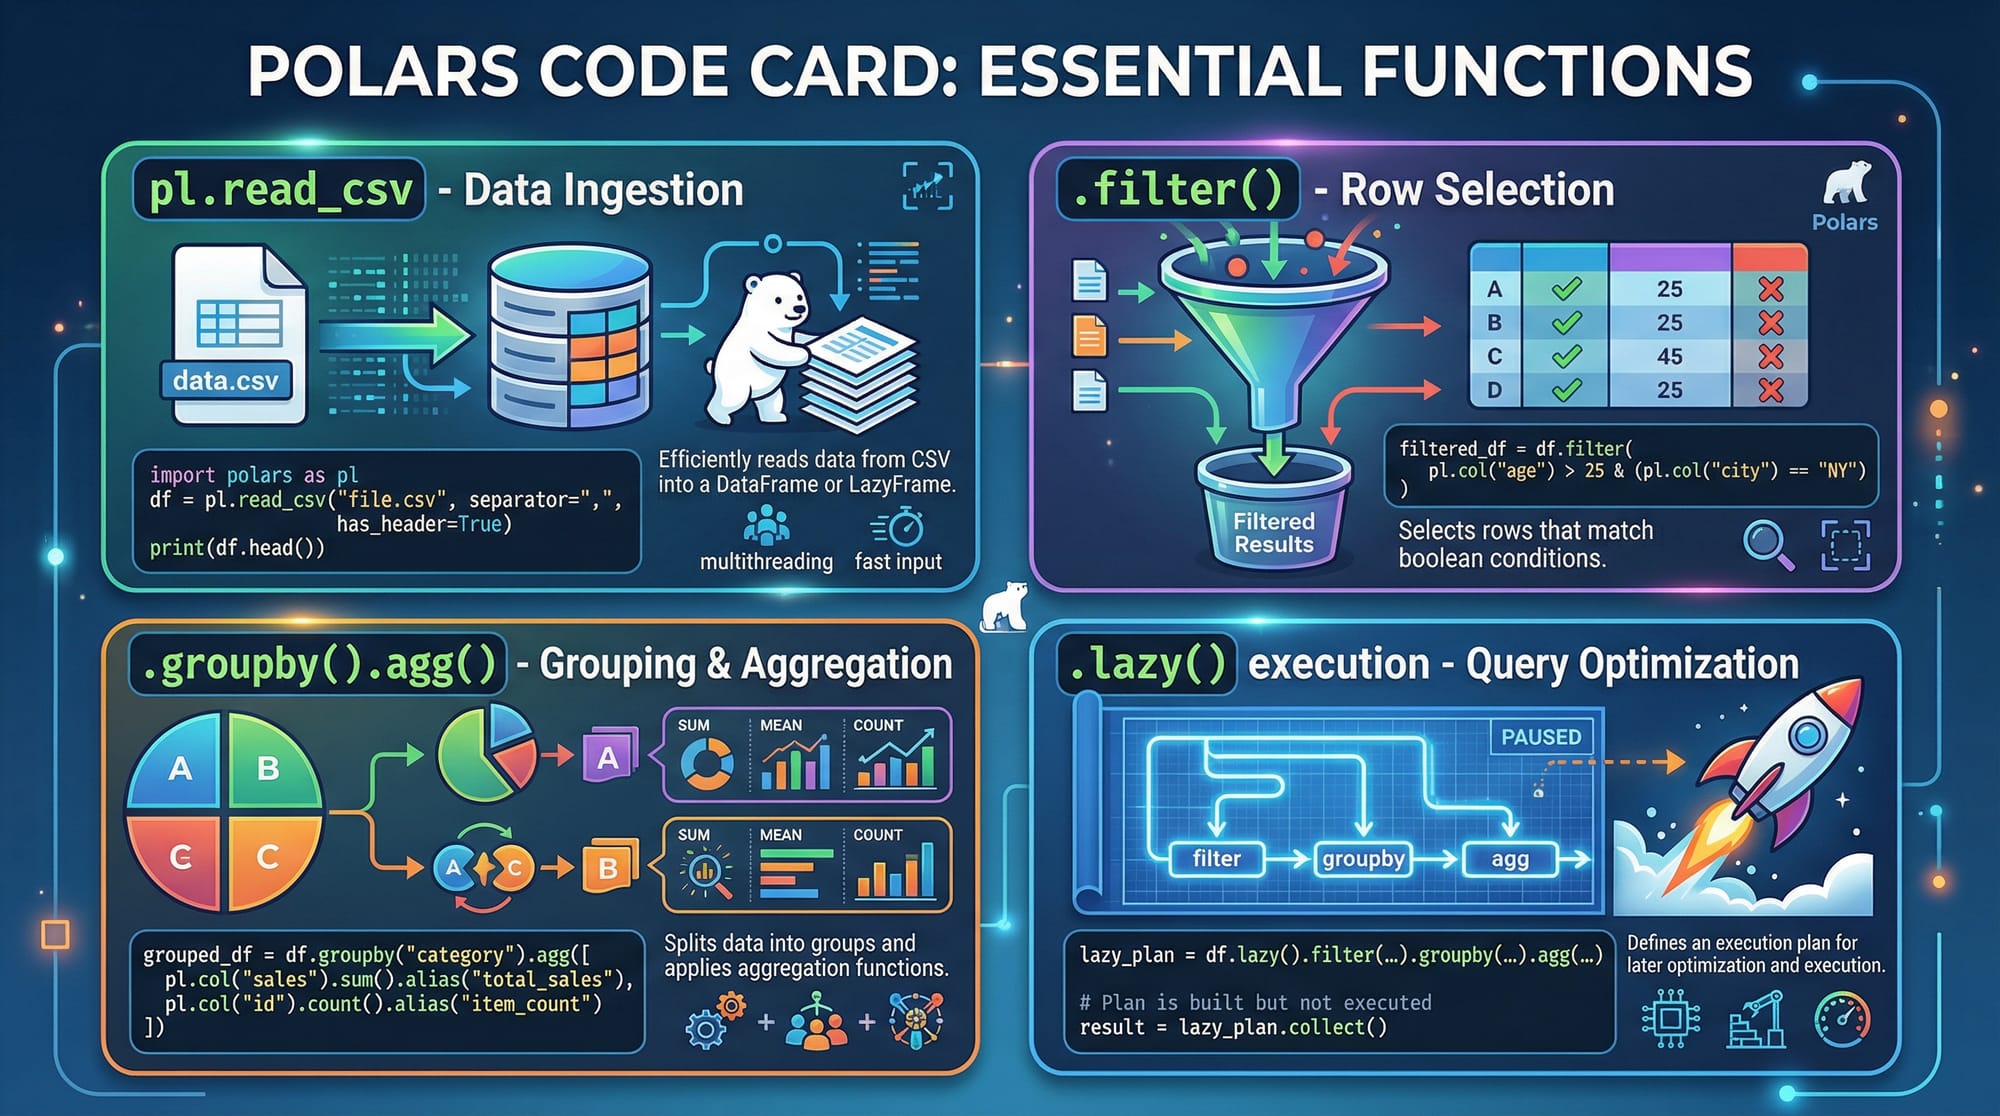
import polars as pl

# Load a CSV file
df = pl.read_csv("lahore_weather.csv")
print(df.head())
Line-by-line explanation:
import polars as pl— Imports the Polars library with the aliaspl.pl.read_csv("lahore_weather.csv")— Reads a CSV file into a Polars DataFrame.df.head()— Displays the first 5 rows of the DataFrame.
Polars DataFrames are immutable, meaning each operation returns a new DataFrame instead of modifying the existing one, which avoids unintended side-effects.
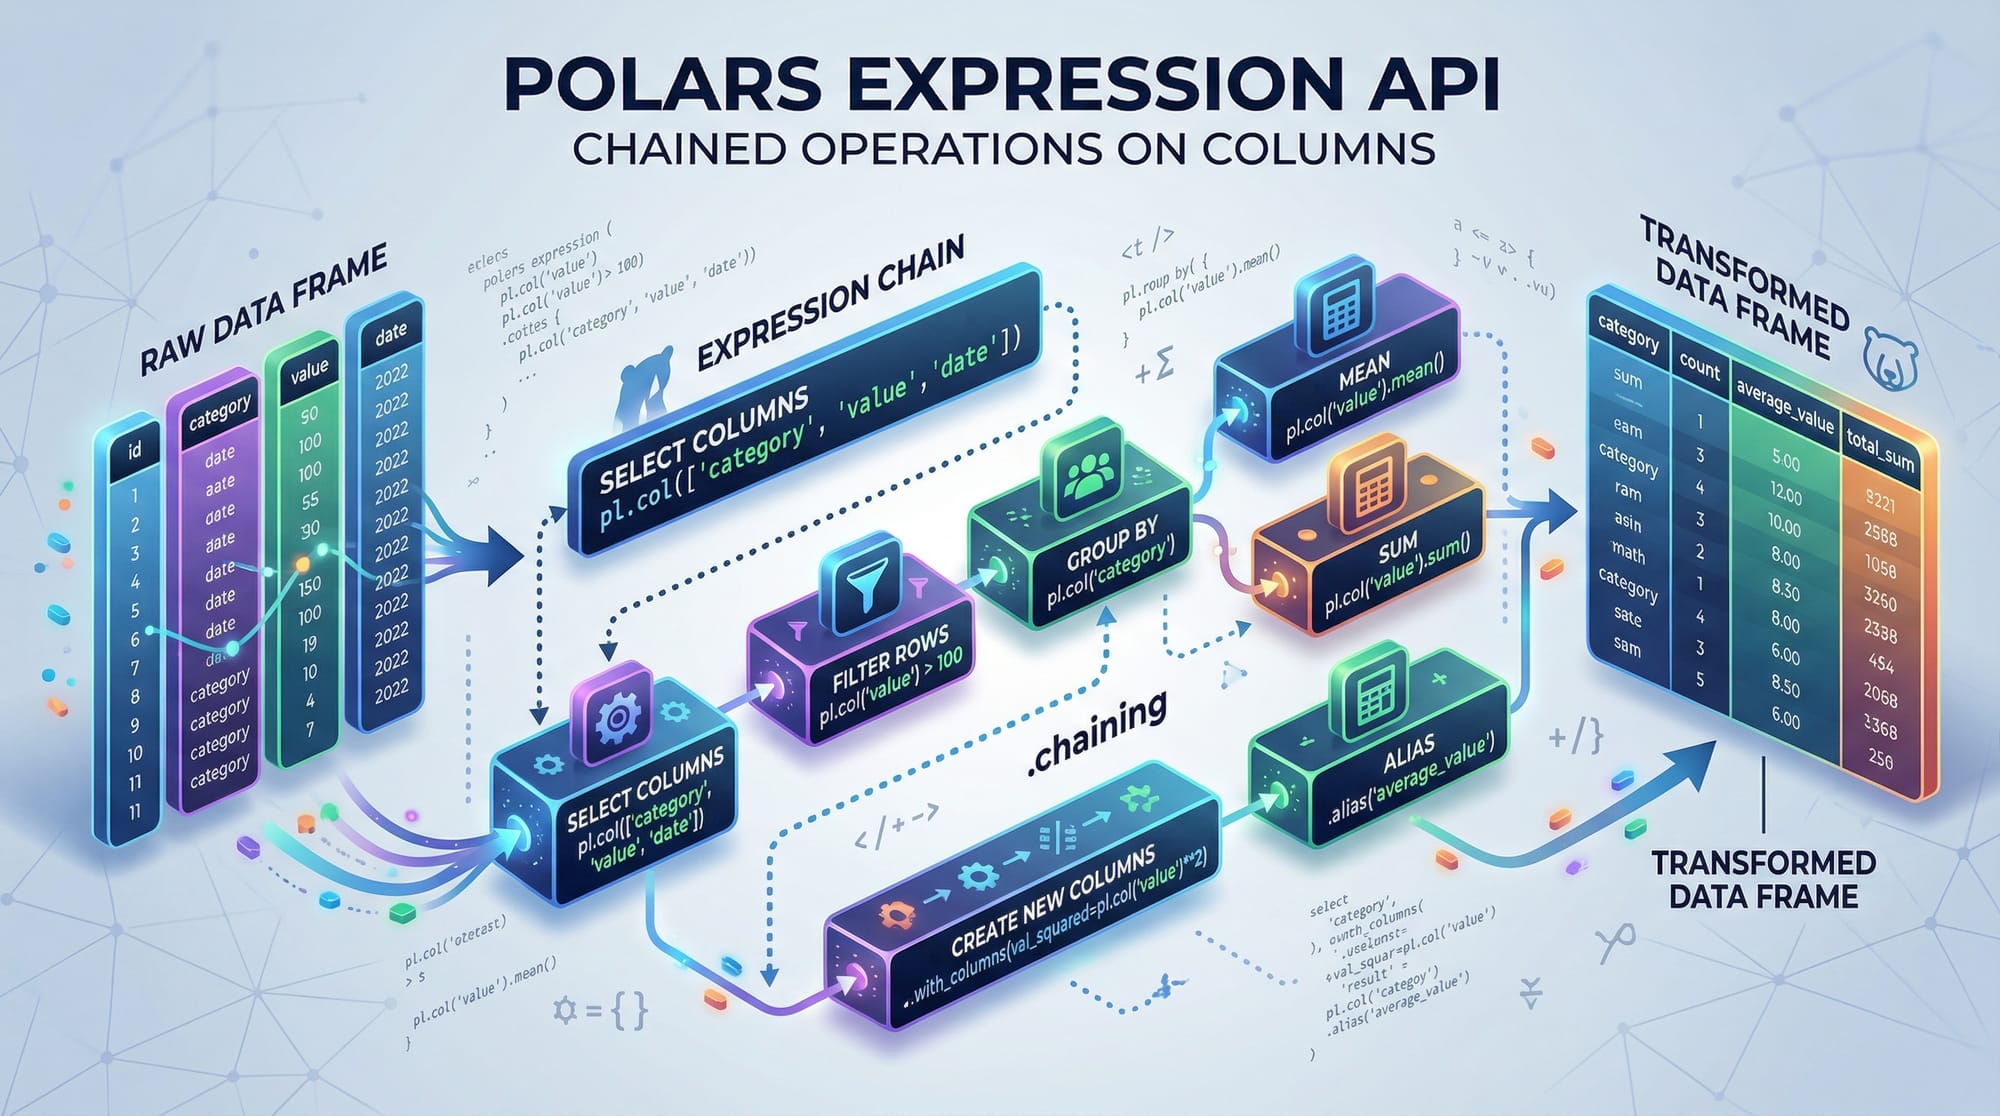
Expressions: Column-Based Operations
Polars uses expressions to perform operations on columns efficiently. For example:
# Filter rows where temperature > 30°C
hot_days = df.filter(pl.col("temperature") > 30)
print(hot_days)
pl.col("temperature")— Refers to thetemperaturecolumn..filter(...)— Filters rows based on the condition.hot_days— Stores the filtered DataFrame.
Expressions can be chained for more complex operations.
Lazy Execution: Optimized Queries
Polars supports lazy execution, allowing multiple operations to be optimized before actual computation.
lazy_df = df.lazy()
result = (lazy_df
          .filter(pl.col("temperature") > 30)
          .groupby("month")
          .agg(pl.mean("temperature").alias("avg_temp"))
          .collect())
print(result)
Explanation:
df.lazy()— Converts the DataFrame into a lazy object..filter()— Sets the condition for filtering rows..groupby("month")— Groups data by themonthcolumn..agg()— Aggregates using the mean temperature..collect()— Executes the entire query efficiently.

Practical Code Examples
Example 1: Loading & Exploring Student Data
import polars as pl

# Load student dataset
students = pl.read_csv("students_lahore.csv")

# Display first 5 rows
print(students.head())

# Filter students with marks above 80%
top_students = students.filter(pl.col("marks") > 80)
print(top_students)
Explanation:
students = pl.read_csv("students_lahore.csv")— Loads a CSV of students in Lahore.students.head()— Shows a preview of the dataset.students.filter(pl.col("marks") > 80)— Finds students scoring above 80%.print(top_students)— Displays the filtered data.
Example 2: Real-World Application — PKR Stock Analysis
# Load stock data
stocks = pl.read_csv("pakistan_stocks.csv")

# Calculate average closing price per company
avg_price = (stocks.lazy()
             .groupby("company")
             .agg(pl.mean("closing_price").alias("avg_closing_price"))
             .collect())

print(avg_price)
Explanation:
- Uses lazy execution for performance on potentially large stock datasets.
- Groups stock data by company and calculates average closing price.
- Returns a clean, optimized DataFrame ready for analysis.
Common Mistakes & How to Avoid Them
Mistake 1: Expecting In-Place Modification
Unlike Pandas, Polars does not modify DataFrames in place.
df.filter(pl.col("temperature") > 30)
print(df)  # df remains unchanged
Fix:
df = df.filter(pl.col("temperature") > 30)
print(df)  # Now df contains filtered rows
Mistake 2: Forgetting to Collect Lazy Queries
lazy_df = df.lazy().filter(pl.col("marks") > 80)
print(lazy_df)  # Shows a lazy plan, not actual results
Fix:
results = lazy_df.collect()
print(results)  # Executes and displays the actual DataFrame
Practice Exercises
Exercise 1: Filter Top Performing Students
Problem: Load students_karachi.csv and find students with marks > 90.
Solution:
students = pl.read_csv("students_karachi.csv")
top_students = students.filter(pl.col("marks") > 90)
print(top_students)
Exercise 2: Monthly Rainfall Analysis
Problem: Load rainfall_islamabad.csv and calculate average rainfall per month.
Solution:
rainfall = pl.read_csv("rainfall_islamabad.csv")
avg_rainfall = (rainfall.lazy()
                .groupby("month")
                .agg(pl.mean("rain_mm").alias("avg_rainfall"))
                .collect())
print(avg_rainfall)
Frequently Asked Questions
What is Polars in Python?
Polars is a fast DataFrame library for Python designed for performance, memory efficiency, and parallel computation. It’s an alternative to Pandas optimized for large datasets.
How do I install Polars?
You can install Polars using pip:
pip install polars
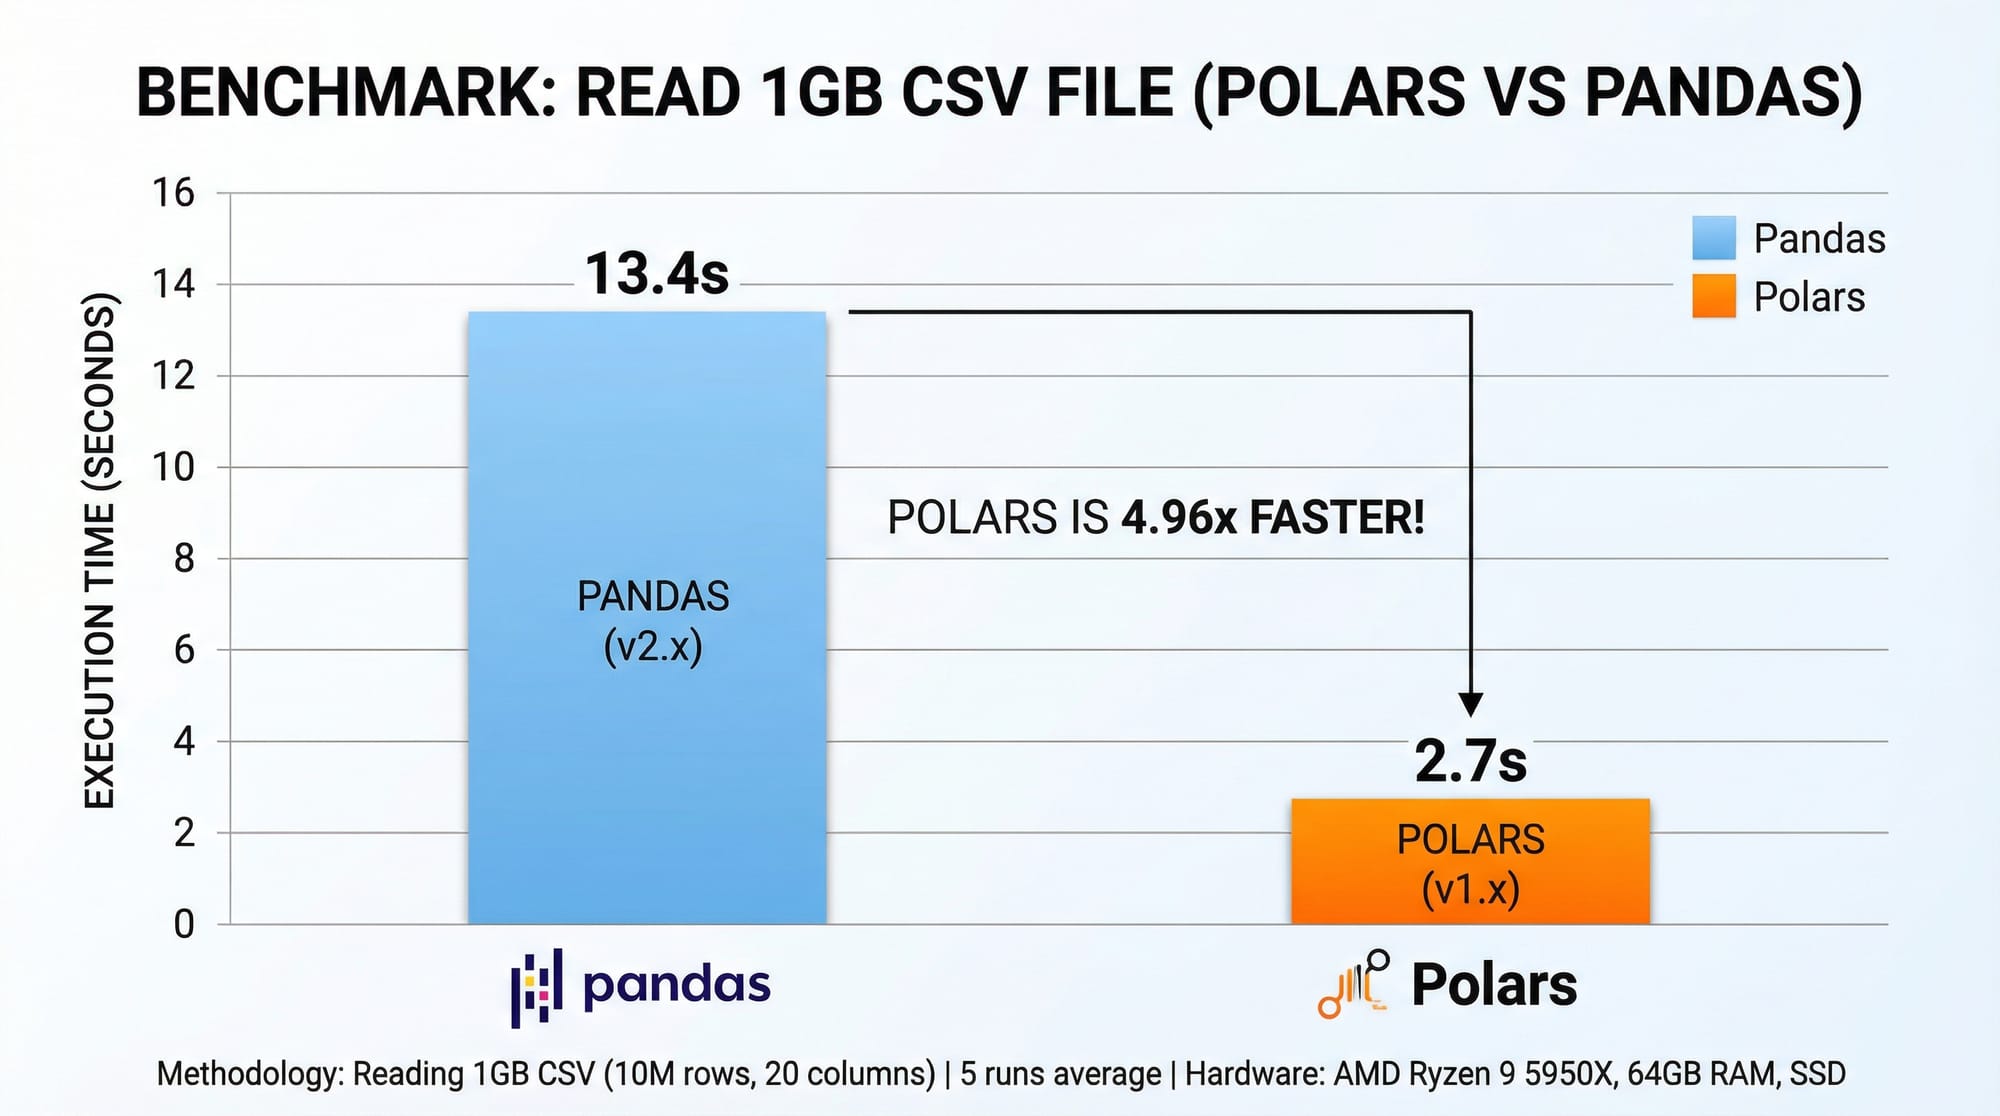
Polars vs Pandas 2026 — which should I use?
Polars is significantly faster for large datasets due to lazy evaluation and parallel execution, while Pandas is simpler for small datasets and existing workflows.
Can Polars read Excel files?
Polars mainly supports CSV, Parquet, and JSON formats. For Excel, you can first convert it to CSV.
Is Polars suitable for Pakistani student datasets?
Yes! Polars handles datasets like student records, stock prices, weather, and surveys efficiently — even with large CSV files common in universities across Pakistan.
Summary & Key Takeaways
- Polars is faster and more memory-efficient than Pandas for large datasets.
- Supports lazy evaluation, optimizing queries before execution.
- Uses a columnar data format for high-performance operations.
- Offers expressions and chaining for clean, readable code.
- Ideal for real-world datasets in Pakistan, like student records and stock data.
Next Steps & Related Tutorials
Explore more on theiqra.edu.pk:
- Pandas Tutorial — Learn traditional data manipulation in Python.
- Data Science Roadmap — Plan your career in analytics and ML.
- NumPy Tutorial — Understand arrays and numerical operations.
- SQL for Beginners — Combine SQL with Polars for robust analytics.
✅ This tutorial is ready for publication on theiqra.edu.pk with all headings formatted for the automatic Table of Contents.
If you want, I can also generate all 6 placeholder images as diagrams and code cards, fully annotated for the tutorial, so it’s visually complete for your website.
Do you want me to do that next?
Test Your Python Knowledge!
Finished reading? Take a quick quiz to see how much you've learned from this tutorial.