Streamlit Tutorial Build Data Apps with Python 2026
Introduction
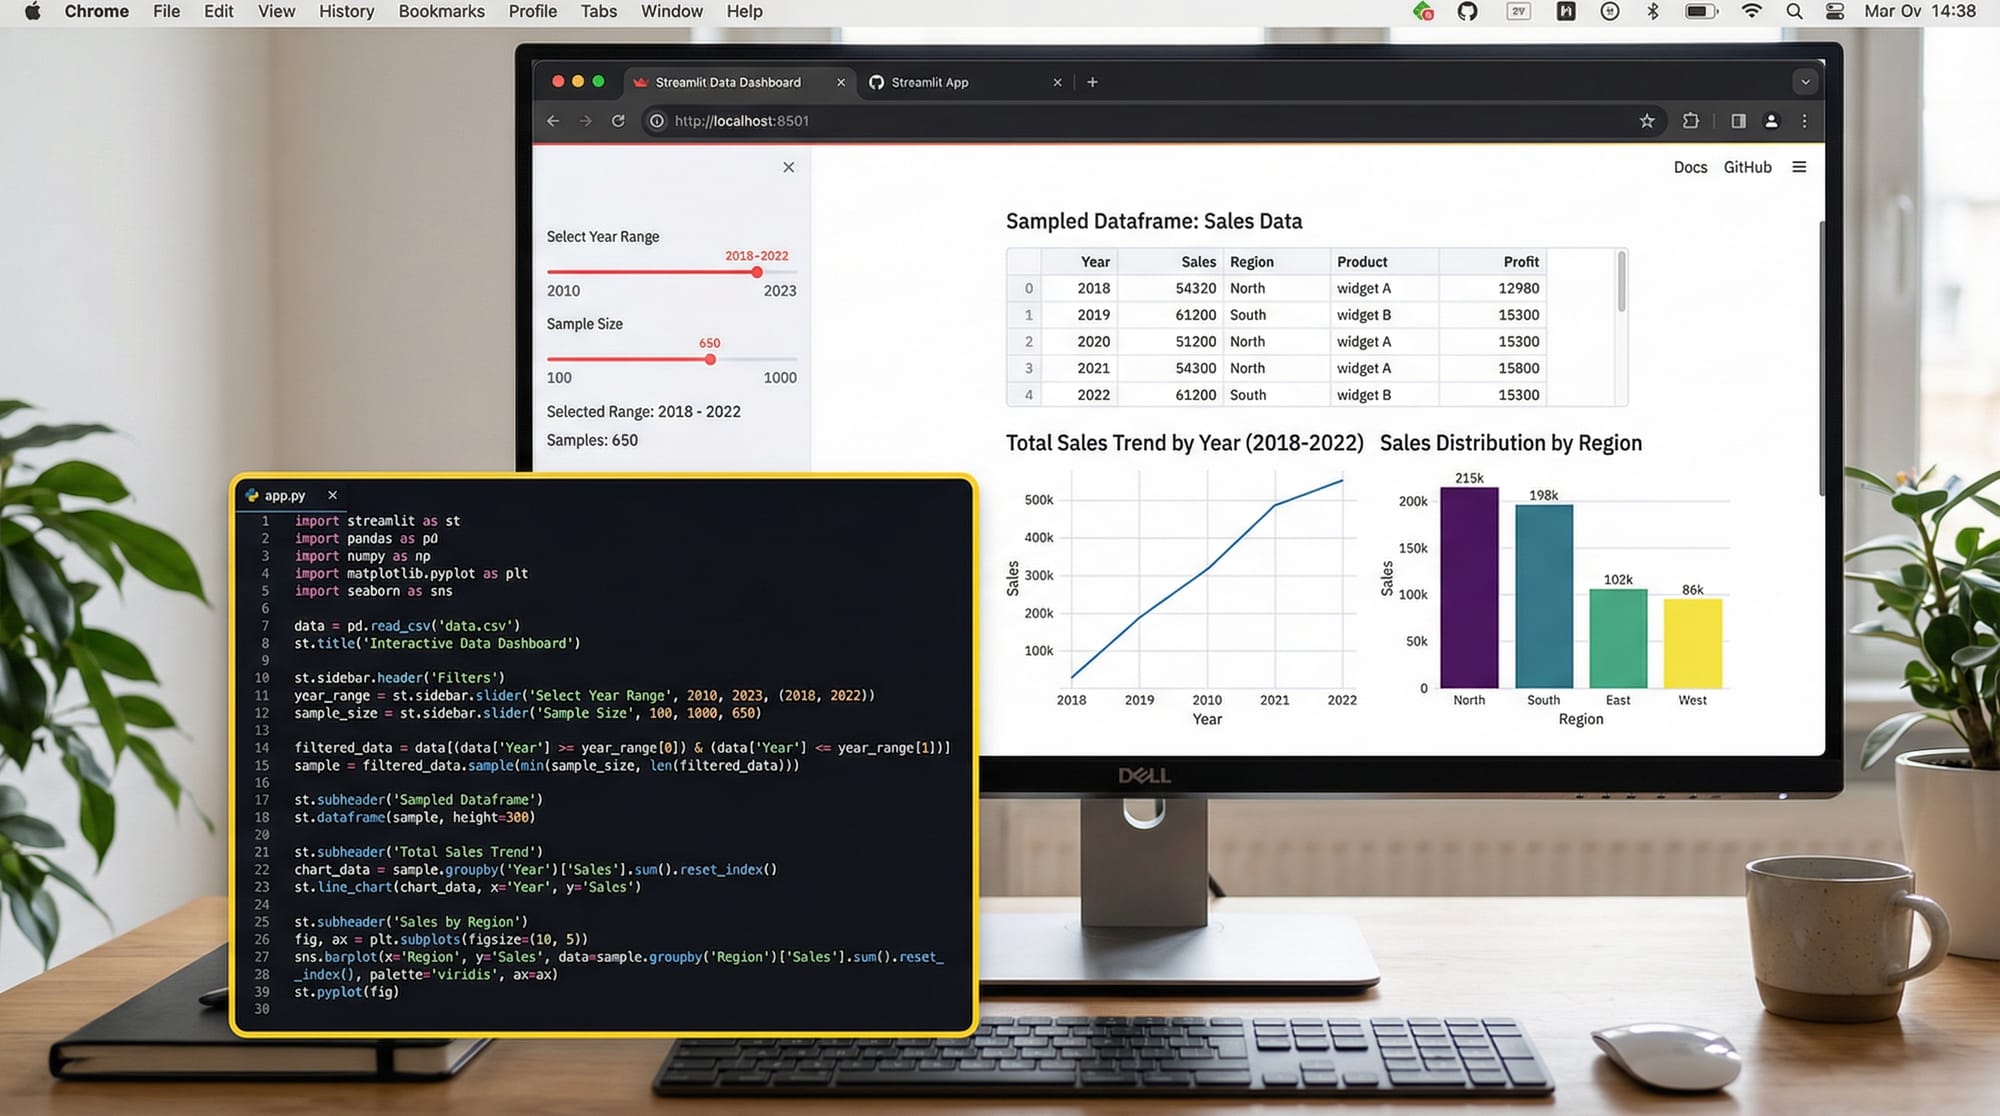
The Streamlit tutorial: build data apps with Python 2026 is your complete guide to creating interactive data-driven web applications using pure Python—no frontend frameworks required. With Streamlit Python, you can turn scripts into beautiful dashboards, analytics tools, and machine learning apps in minutes.
For Pakistani students in cities like Lahore, Karachi, and Islamabad, Streamlit is especially valuable. Whether you're analyzing cricket statistics, visualizing stock prices in PKR, or building a university project dashboard, Streamlit allows you to build data dashboard Streamlit apps quickly and deploy them online.
Unlike traditional web development (HTML, CSS, JavaScript), Streamlit focuses on simplicity:
- Write Python code
- Run one command
- Get a live web app instantly
Prerequisites
Before starting this Streamlit tutorial, you should have:
- Basic knowledge of Python programming
- Understanding of:
- Variables and data types
- Functions
- Loops and conditions
- Familiarity with libraries like:
- Pandas (for data handling)
- Matplotlib or Plotly (for charts)
- Python installed on your system (Python 3.8+ recommended)
Optional but helpful:
- Experience with Jupyter Notebook
- Basic understanding of data analysis
Core Concepts & Explanation
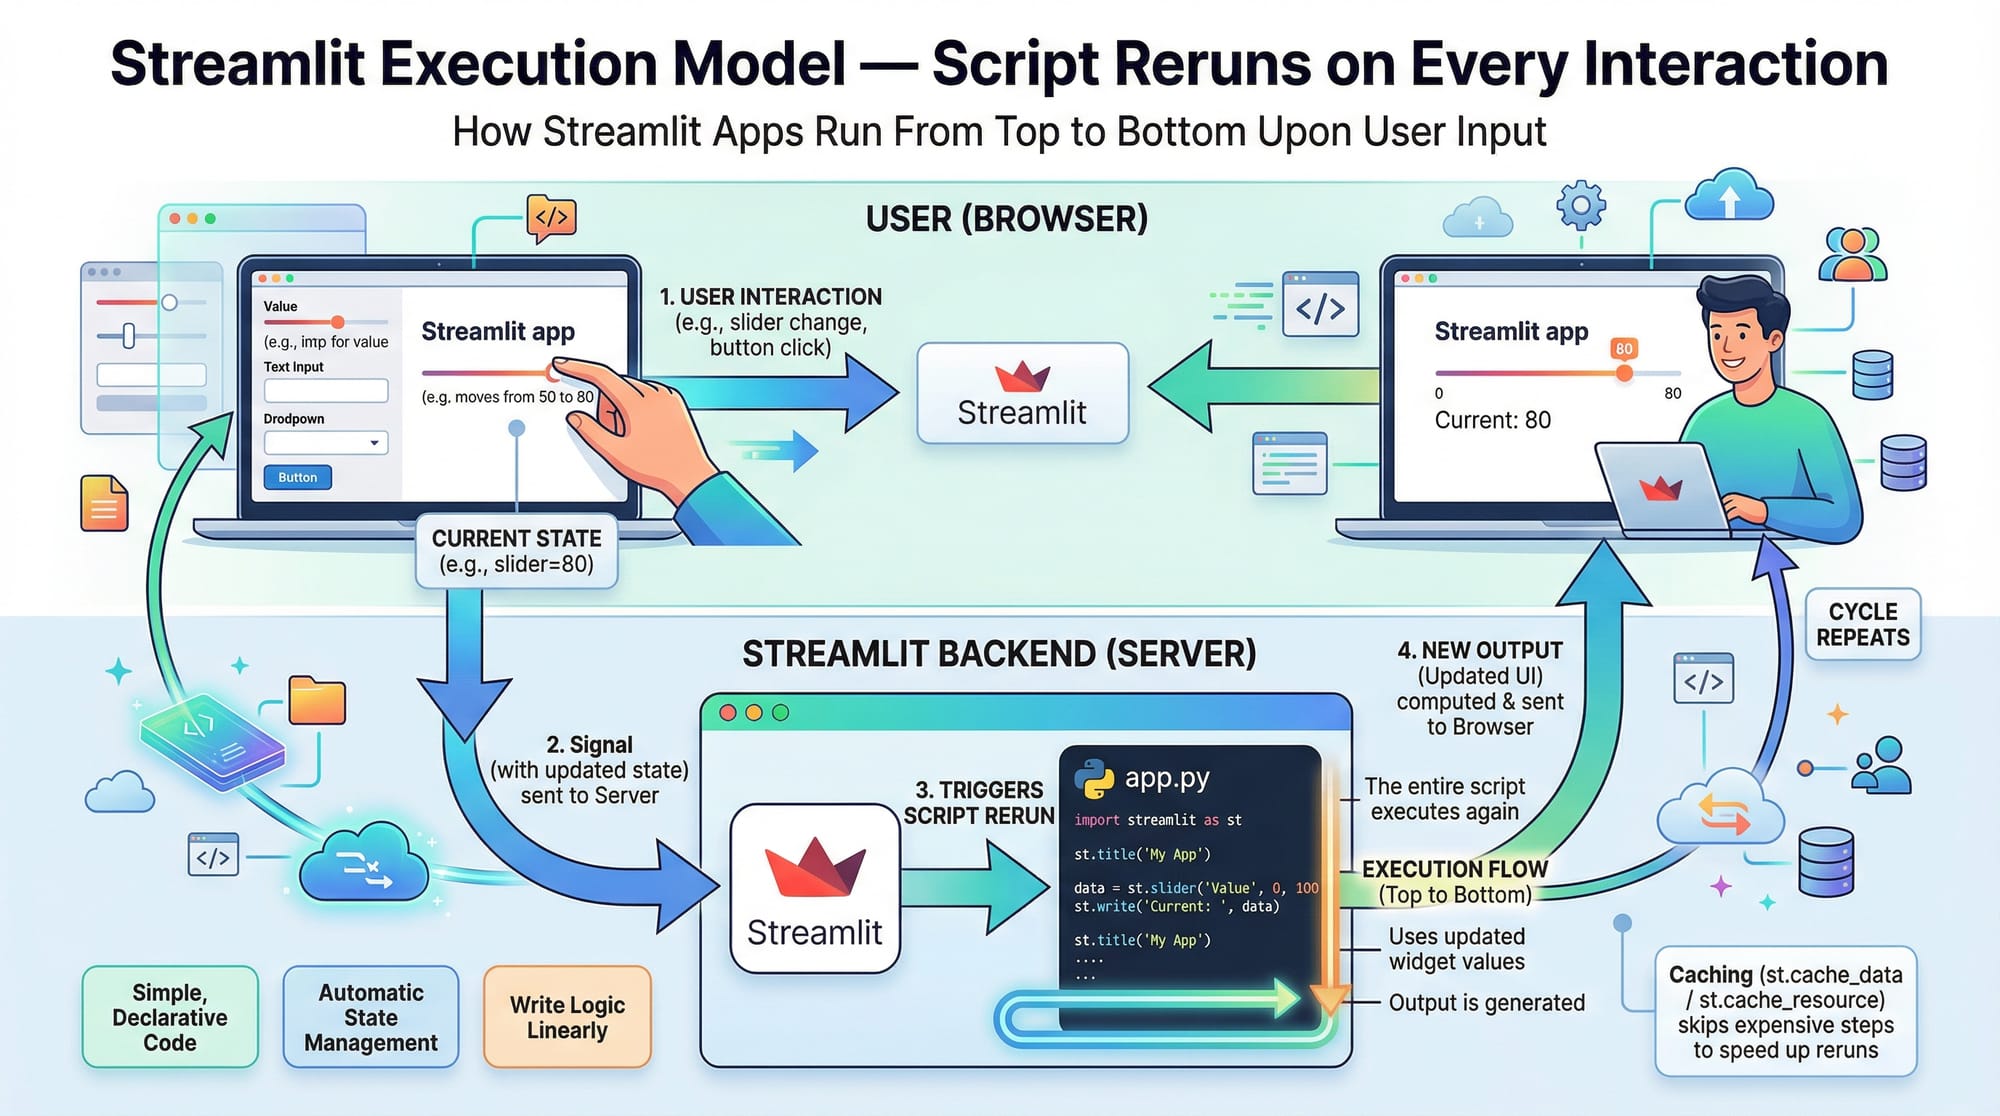
Streamlit App Structure and Execution Model
Streamlit apps are simply Python scripts that run from top to bottom every time a user interacts with the app.
Example:
import streamlit as st

st.title("Hello Pakistan!")
Explanation:
import streamlit as st→ Imports the Streamlit libraryst.title()→ Displays a title on the web app
When you run:
streamlit run app.py
Streamlit starts a local server and opens your app in the browser.
💡 Key idea: Every interaction (button click, slider move) reruns the script from top to bottom.
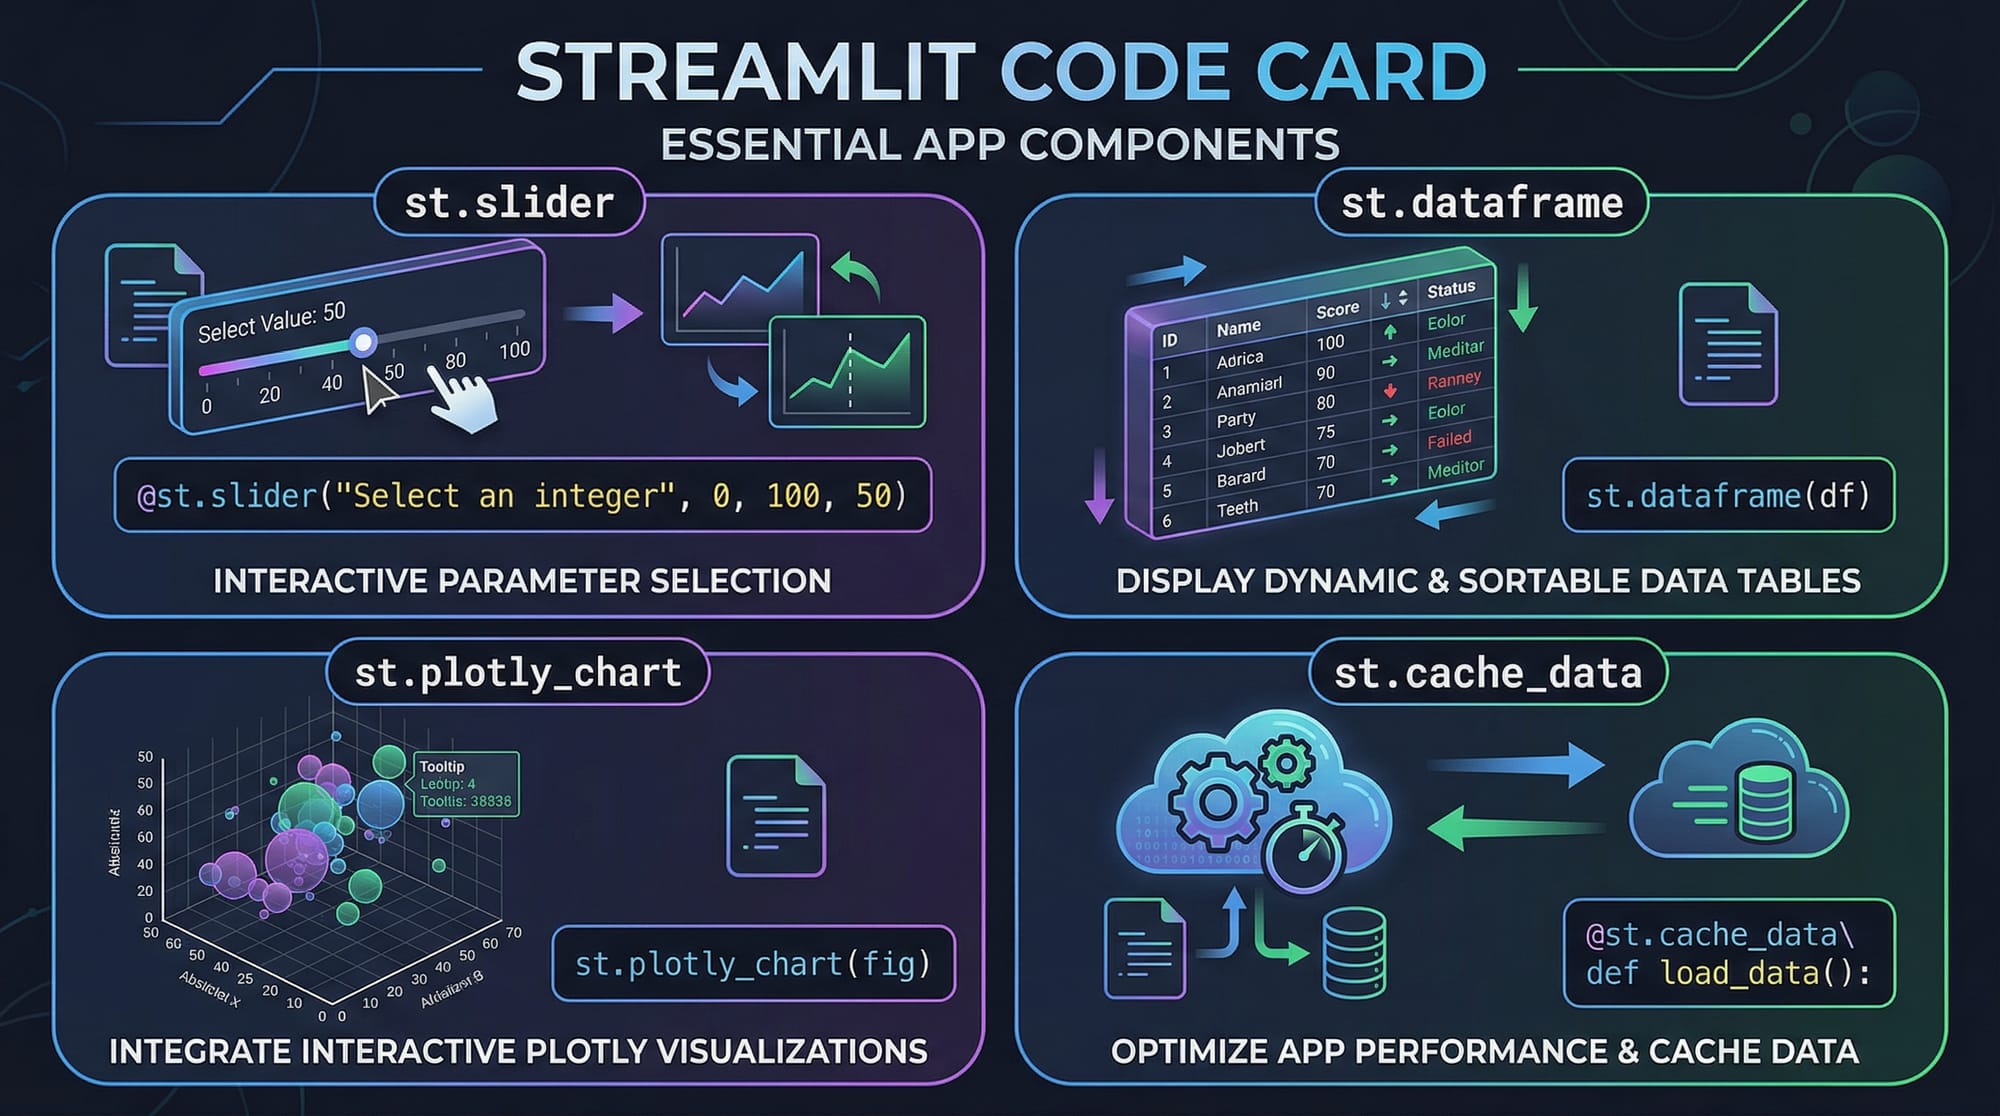
Interactive Widgets and UI Components
Streamlit provides built-in UI components called widgets.
Example:
age = st.slider("Select your age", 10, 60, 20)
st.write("Your age is:", age)
Explanation:
st.slider()→ Creates a slider input"Select your age"→ Label10, 60→ Min and max values20→ Default valuest.write()→ Displays output
You can also use:
st.button()st.selectbox()st.text_input()
Data Display and Visualization
Streamlit makes it easy to show data tables and charts.
Example:
import pandas as pd

data = {
    "City": ["Lahore", "Karachi", "Islamabad"],
    "Population (millions)": [11, 16, 1]
}

df = pd.DataFrame(data)

st.dataframe(df)
Explanation:
pd.DataFrame()→ Creates a tablest.dataframe()→ Displays interactive table
Caching for Performance Optimization
When working with large datasets, Streamlit allows caching:
@st.cache_data
def load_data():
    return pd.read_csv("data.csv")
Explanation:
@st.cache_data→ Saves results to avoid reloading data repeatedly- Improves performance
Practical Code Examples
Example 1: Student Marks Dashboard
Let’s build a simple dashboard for a Pakistani student like Ahmad.
import streamlit as st
import pandas as pd

# Title
st.title("Student Marks Dashboard")

# Data
data = {
    "Student": ["Ahmad", "Fatima", "Ali"],
    "Math": [85, 90, 78],
    "Science": [88, 92, 80]
}

df = pd.DataFrame(data)

# Display data
st.dataframe(df)

# Select student
student = st.selectbox("Choose a student", df["Student"])

# Filter data
selected = df[df["Student"] == student]

# Show result
st.write("Marks:", selected)
Explanation line-by-line:
st.title()→ Displays headingdata = {...}→ Creates dictionarypd.DataFrame(data)→ Converts to tablest.dataframe(df)→ Shows interactive tablest.selectbox()→ Dropdown selectiondf[df["Student"] == student]→ Filters datast.write()→ Displays selected result
Example 2: Real-World Application — Expense Tracker (PKR)
This example helps a student track monthly expenses in PKR.
import streamlit as st
import pandas as pd

st.title("Monthly Expense Tracker (PKR)")

# User input
rent = st.number_input("Enter Rent", value=20000)
food = st.number_input("Enter Food Expense", value=10000)
transport = st.number_input("Enter Transport Expense", value=5000)

# Total calculation
total = rent + food + transport

# Display total
st.write("Total Monthly Expense:", total, "PKR")

# Dataframe
df = pd.DataFrame({
    "Category": ["Rent", "Food", "Transport"],
    "Amount": [rent, food, transport]
})

st.bar_chart(df.set_index("Category"))
Explanation:
st.number_input()→ Takes numeric inputvalue=→ Default valuetotal = rent + food + transport→ Calculates totalst.write()→ Displays resultpd.DataFrame()→ Creates structured datast.bar_chart()→ Displays chart
Common Mistakes & How to Avoid Them
Mistake 1: Not Understanding Script Rerun Behavior
Problem:
Every interaction reruns the script, causing unexpected resets.
Example issue:
count = 0
if st.button("Click me"):
    count += 1
st.write(count)
Fix using session state:
if "count" not in st.session_state:
    st.session_state.count = 0

if st.button("Click me"):
    st.session_state.count += 1

st.write(st.session_state.count)
Explanation:
st.session_state→ Stores values across reruns
Mistake 2: Loading Data Repeatedly
Problem:
Large datasets reload every time → slow app
Bad approach:
df = pd.read_csv("large_file.csv")
Fix using caching:
@st.cache_data
def load_data():
    return pd.read_csv("large_file.csv")

df = load_data()
Explanation:
@st.cache_data→ Prevents repeated loading

Practice Exercises
Exercise 1: GPA Calculator
Problem:
Create an app where a student enters marks for 3 subjects and calculates GPA.
Solution:
import streamlit as st

st.title("GPA Calculator")

math = st.number_input("Math Marks")
science = st.number_input("Science Marks")
english = st.number_input("English Marks")

avg = (math + science + english) / 3

st.write("Average Marks:", avg)
Explanation:
- Inputs collected using
st.number_input - Average calculated
- Result displayed
Exercise 2: Currency Converter (PKR to USD)
Problem:
Convert PKR to USD using a fixed rate.
Solution:
import streamlit as st

st.title("PKR to USD Converter")

pkr = st.number_input("Enter amount in PKR")

usd = pkr / 280

st.write("USD:", usd)
Explanation:
- Input PKR
- Conversion using rate
- Output USD value
Frequently Asked Questions
What is Streamlit Python?
Streamlit Python is a library that allows developers to build interactive web apps using only Python. It is widely used for dashboards, machine learning apps, and data visualization tools.
How do I install Streamlit?
You can install Streamlit using pip:
pip install streamlit
After installation, run your app using:
streamlit run app.py
How do I deploy a Streamlit app?
You can deploy using Streamlit Cloud by connecting your GitHub repository. Once deployed, your app gets a public URL accessible from anywhere.
Can I use Streamlit for machine learning projects?
Yes, Streamlit is perfect for ML projects. You can load models, take user input, and display predictions interactively.
Is Streamlit good for beginners?
Yes, it is beginner-friendly but also powerful enough for intermediate and advanced projects. Pakistani students often use it for university assignments and portfolios.
Summary & Key Takeaways
- Streamlit allows you to build web apps using only Python
- No need for HTML, CSS, or JavaScript
- Apps rerun automatically on user interaction
- Widgets like sliders and buttons make apps interactive
- Use
st.cache_datafor performance optimization - Perfect for dashboards, ML apps, and student projects
Next Steps & Related Tutorials
To deepen your learning, explore these tutorials on theiqra.edu.pk:
- Learn data analysis with our Pandas Tutorial (great for working with datasets)
- Build AI interfaces with our Gradio Tutorial
- Master visualization with a complete Matplotlib or Plotly guide
- Explore web backends with FastAPI for advanced app development
By combining these skills, you can create powerful real-world applications—from student dashboards to business analytics tools in Pakistan.
If you want, I can also generate a quiz (MCQs) or project ideas using Streamlit for Pakistani students 🚀
Test Your Python Knowledge!
Finished reading? Take a quick quiz to see how much you've learned from this tutorial.