Linux Performance Tuning CPU Memory I/O & Networking

Introduction
Linux performance tuning: CPU, Memory, I/O & Networking is the process of improving how efficiently a Linux system uses its hardware resources. It involves monitoring system behavior, identifying bottlenecks, and applying optimization techniques to ensure better speed, stability, and scalability.
For Pakistani students learning Linux administration, DevOps, or backend engineering, performance tuning is a highly valuable skill. Whether you are running a student project in Lahore, hosting a website for a startup in Karachi, or managing a VPS from Islamabad, understanding Linux performance can save costs (PKR), improve system reliability, and prepare you for real-world industry roles.
In modern IT environments, poorly optimized Linux systems can lead to slow applications, server crashes, and high infrastructure costs. This tutorial will guide you through essential concepts, tools, and real-world techniques using linux monitoring tools and optimization strategies.
Prerequisites
Before starting this tutorial, you should have:
- Basic understanding of Linux command line (bash)
- Familiarity with processes and services in Linux
- Knowledge of file system basics (ext4, directories, permissions)
- Understanding of RAM, CPU, and storage concepts
- Basic networking knowledge (IP, ports, DNS)
Recommended tutorials on theiqra.edu.pk:
- Linux Command Line Basics
- Linux File System Structure
- Introduction to Linux Networking
Core Concepts & Explanation
CPU Scheduling, Load Average & Process Priority
Linux distributes CPU time among processes using a scheduler. When too many processes compete for CPU, performance slows down.
Key concepts:
- Load Average: Represents system demand over 1, 5, and 15 minutes
- nice/renice values: Control process priority (-20 highest priority, 19 lowest)
- CPU steal time: Time “stolen” by virtual machines in cloud environments
Example:
A student named Ahmad runs a Python script consuming 100% CPU. Other services like Apache become slow. By lowering Ahmad’s process priority using nice, system responsiveness improves.
Memory Management, Cache & Swap Behavior
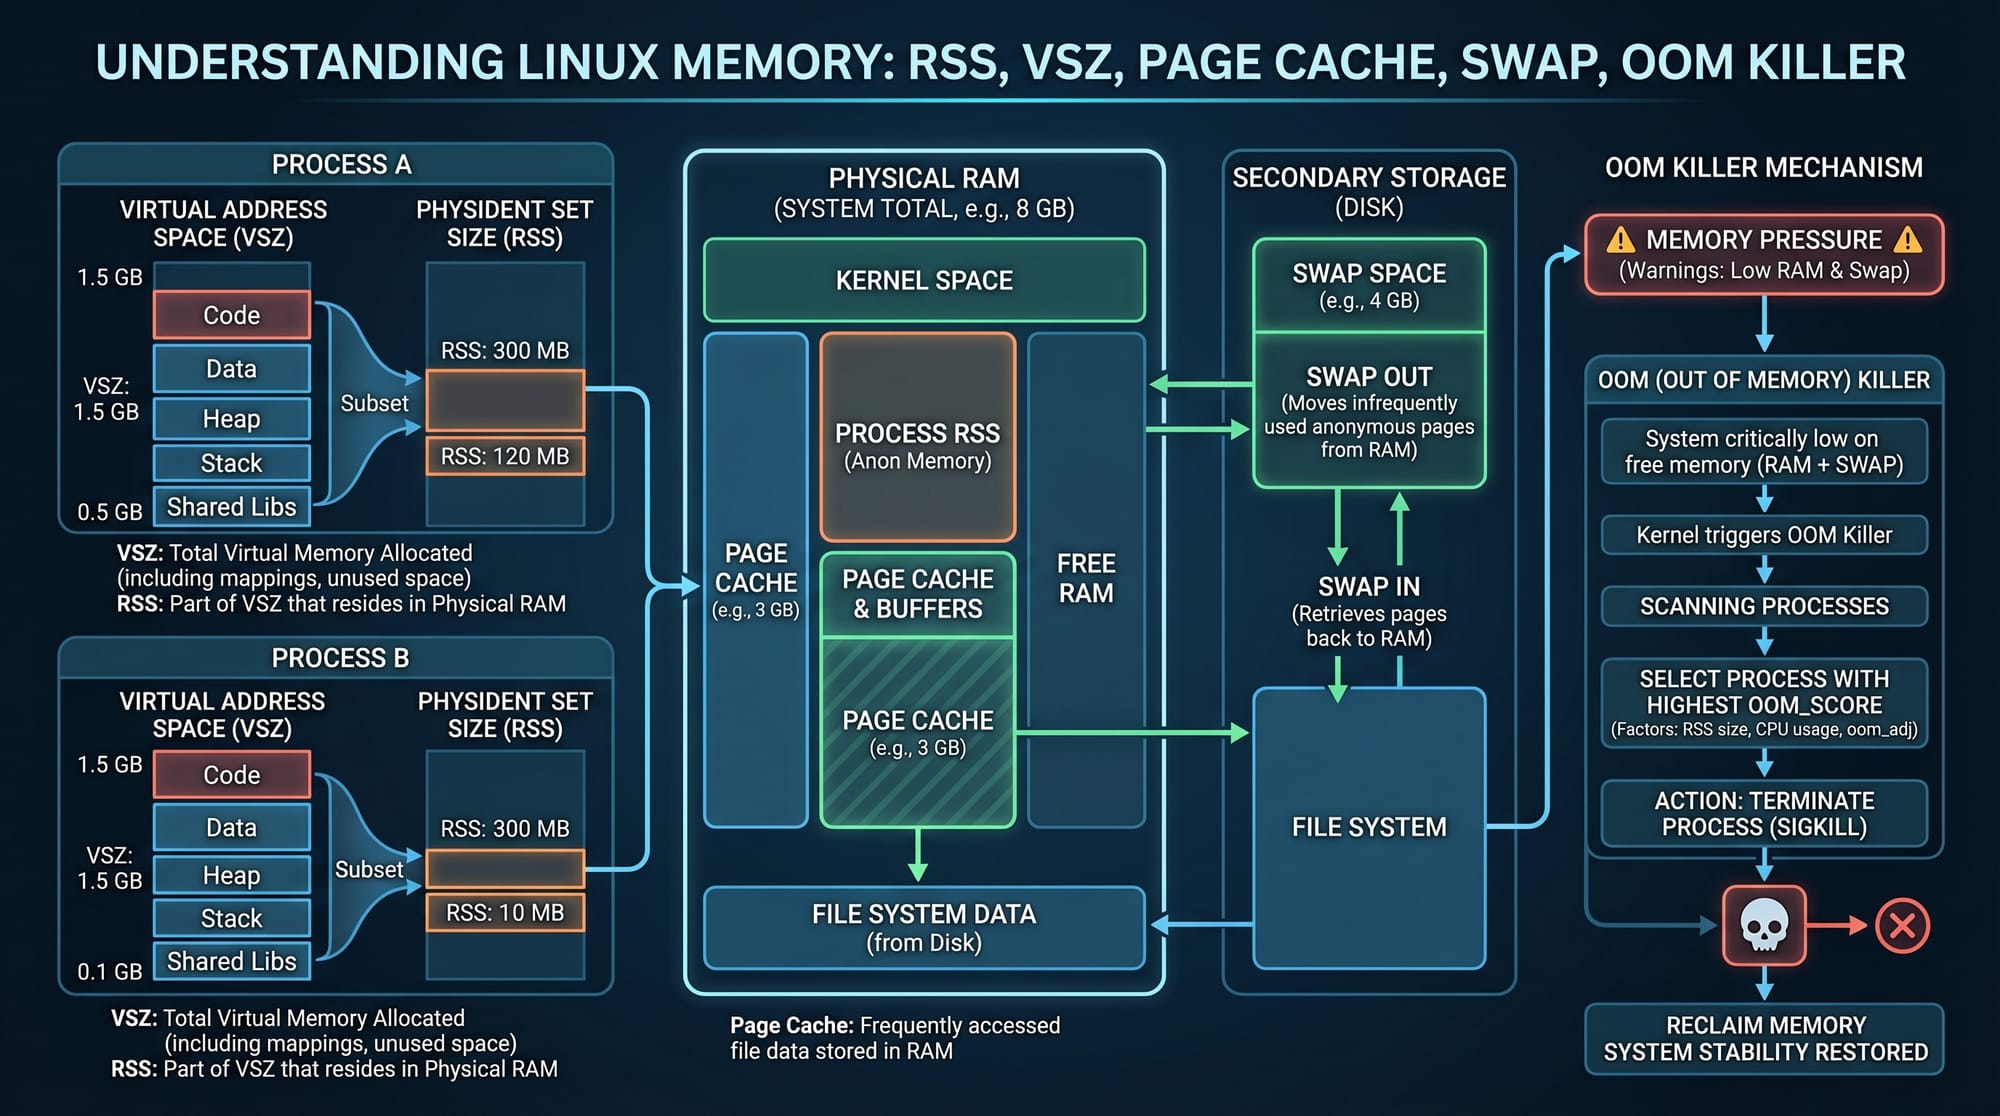
Linux manages memory dynamically using:
- RAM (physical memory)
- Page cache (file caching for speed)
- Swap (disk-based memory fallback)
When RAM is full, Linux uses swap, which is slower but prevents crashes.
Key metrics:
- RSS (Resident Set Size): Actual physical memory used
- VSZ (Virtual Size): Total memory allocated
- OOM Killer: System process that kills heavy processes when memory is exhausted

Disk I/O Scheduling & Throughput Optimization
Disk performance is often a hidden bottleneck in Linux systems.
Important tools:
iostat– monitors disk usageiotop– shows real-time disk usage per process- I/O schedulers: mq-deadline, cfq, noop
Example:
A database running in Karachi data center becomes slow due to high disk latency. Switching from default scheduler to mq-deadline improves throughput.
Network Stack Tuning & Latency Control
Networking performance is critical for web servers, APIs, and cloud applications.
Key tuning areas:
- TCP buffer sizes
- Connection backlog limits
- SYN flood protection
- DNS caching
Tools:
ssnetstattcpdump
Optimizing networking can significantly improve website response times for users in Pakistan and globally.
Practical Code Examples
Example 1: System Performance Monitoring Script
#!/bin/bash
# CPU usage check using top snapshot
top -bn1 | head -20

# Memory usage summary
free -h

# Disk I/O statistics
iostat -x 1 3

# System load average
uptime
Explanation:
#!/bin/bash→ Specifies shell interpretertop -bn1→ Captures one-time snapshot of CPU usagehead -20→ Shows top 20 lines of outputfree -h→ Displays memory usage in human-readable formatiostat -x 1 3→ Shows extended disk stats, refreshed 3 times every 1 seconduptime→ Shows system load average and runtime
This script helps students quickly assess system health before deploying applications.
Example 2: Real-World Web Server Optimization
# Increase file descriptor limits
ulimit -n 65535

# Improve network performance
sysctl -w net.core.somaxconn=65535
sysctl -w net.ipv4.tcp_tw_reuse=1
sysctl -w net.ipv4.ip_local_port_range="1024 65000"

# Reduce swappiness (less swap usage)
sysctl -w vm.swappiness=10
Explanation:
ulimit -n 65535→ Allows more open files (useful for web servers)somaxconn→ Increases max queued connectionstcp_tw_reuse→ Reuses TCP connections in TIME_WAIT stateip_local_port_range→ Expands available ports for outgoing connectionsvm.swappiness=10→ Reduces swapping, improving performance
This configuration is commonly used in production environments running Nginx or Node.js applications.
Common Mistakes & How to Avoid Them
Mistake 1: Blindly Changing sysctl Values
Many beginners copy random sysctl commands from the internet without understanding them.
Problem:
- Can cause network instability
- May degrade performance instead of improving it
Fix:
- Always test changes in staging environment
- Use
sysctl -ato review current values - Apply changes gradually
Mistake 2: Ignoring the Real Bottleneck
Students often optimize CPU while the real issue is disk or memory.
Example:
Fatima from Lahore optimized CPU usage but ignored slow SSD performance, causing no real improvement.
Fix:
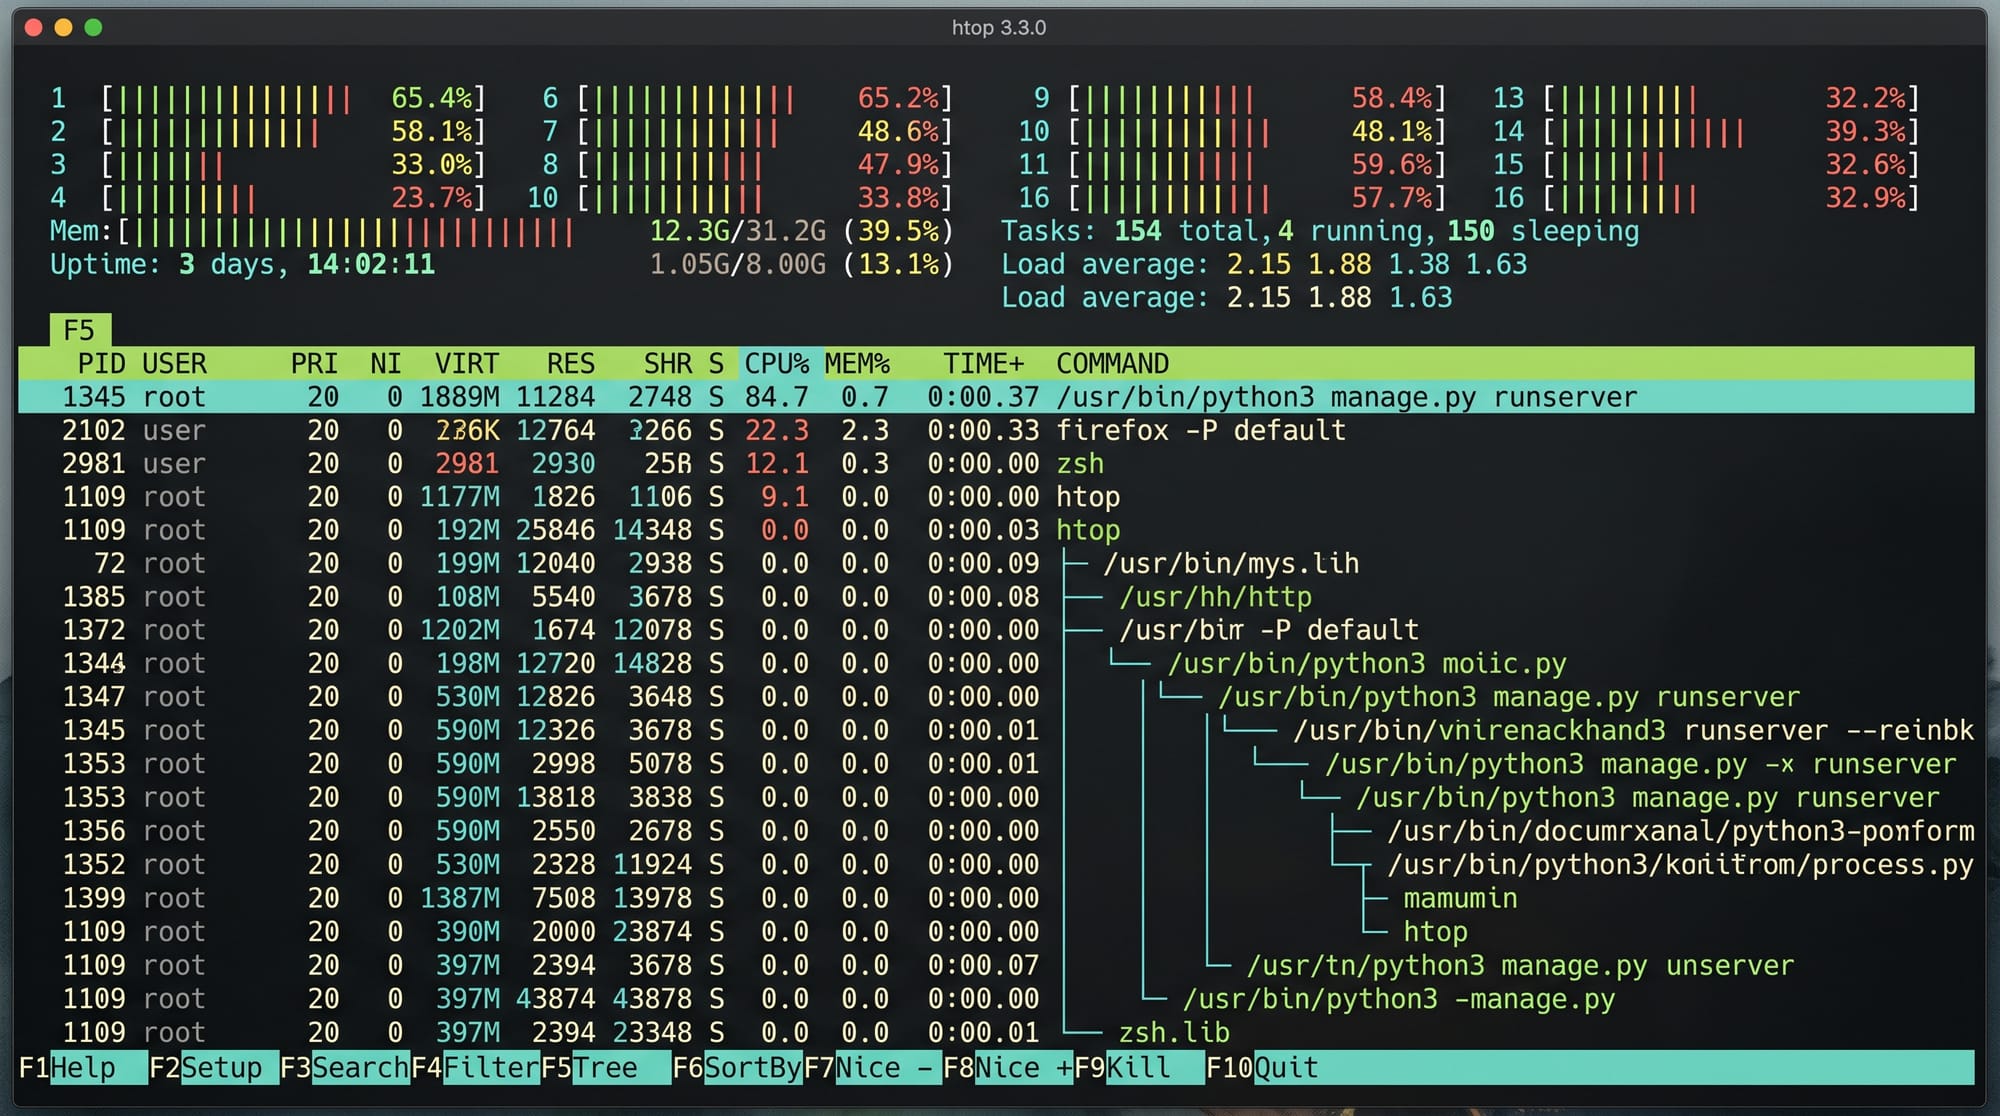
- Use
top,htop,iotop, andvmstat - Identify whether CPU, memory, or I/O is the actual bottleneck
Practice Exercises
Exercise 1: Identify CPU Bottleneck
Problem:
A Linux system is slow, and one process is using 100% CPU.
Task:
- Identify the process
- Reduce its priority
Solution:
top
renice +10 -p <PID>
Explanation:
topidentifies high CPU processrenicelowers its priority so system remains responsive
Exercise 2: Detect Memory Leak
Problem:
A server keeps slowing down after running for hours.
Solution:
ps aux --sort=-%mem | head
watch free -h
Explanation:
- First command lists memory-heavy processes
- Second command monitors memory usage in real time
Frequently Asked Questions
What is Linux performance tuning?
Linux performance tuning is the process of optimizing CPU, memory, disk I/O, and network usage to improve system efficiency and responsiveness. It helps ensure smooth operation of servers and applications.
Why is Linux performance tuning important for students?
It prepares students for real-world jobs in DevOps, cloud computing, and system administration. Optimized systems reduce costs and improve reliability.
How do I monitor Linux performance effectively?
You can use tools like top, htop, vmstat, iostat, and netstat to monitor CPU, memory, disk, and network performance in real time.
What is the most common Linux performance bottleneck?
In most real-world systems, disk I/O and memory shortages are more common bottlenecks than CPU usage.
How can I improve Linux server performance quickly?
You can improve performance by optimizing sysctl settings, reducing swap usage, increasing file descriptors, and identifying resource-heavy processes.
Summary & Key Takeaways
- Linux performance tuning improves CPU, memory, I/O, and network efficiency
- Monitoring tools are essential for identifying bottlenecks
- CPU is not always the main performance issue—check memory and disk first
- sysctl and ulimit are powerful optimization tools
- Real-world tuning requires testing, not guesswork
- Understanding system behavior is key for DevOps and Linux administration careers
Next Steps & Related Tutorials
To strengthen your Linux expertise, continue learning with:
- Linux Administration Fundamentals
- Operating Systems Concepts in Linux
- Linux Networking Deep Dive
- DevOps and System Monitoring Basics
If you want, I can also convert this into a blog-ready HTML version with SEO schema markup + FAQ JSON-LD for theiqra.edu.pk.
Test Your Python Knowledge!
Finished reading? Take a quick quiz to see how much you've learned from this tutorial.