Pandas Tutorial Data Analysis & Manipulation with Python
Introduction
Welcome to this Pandas Tutorial: Data Analysis & Manipulation with Python — a complete guide designed especially for Pakistani students stepping into the world of data science.
If you’ve ever worked with Excel sheets, you already understand rows, columns, and tables. Now imagine doing all of that — but faster, smarter, and with automation using Python. That’s exactly what pandas python offers.
Pandas is one of the most powerful Python libraries used for:
- Data analysis
- Data cleaning
- Data manipulation
- Data visualization preparation
Whether you're analyzing student results in Lahore, sales data in Karachi, or survey responses in Islamabad, pandas helps you turn raw data into meaningful insights.
Why should Pakistani students learn pandas?
- High demand in data science and AI jobs
- Used in freelancing platforms (Fiverr, Upwork)
- Essential for fields like finance, healthcare, and business analytics
- Works well with other tools like NumPy and Matplotlib
Prerequisites
Before starting this pandas dataframe guide, you should have:
- Basic knowledge of Python (variables, loops, functions)
- Understanding of lists and dictionaries
- Python installed on your system
- Familiarity with CSV/Excel files (helpful but not required)
Optional but recommended:
- Basic understanding of NumPy
- Jupyter Notebook or VS Code for coding
Core Concepts & Explanation
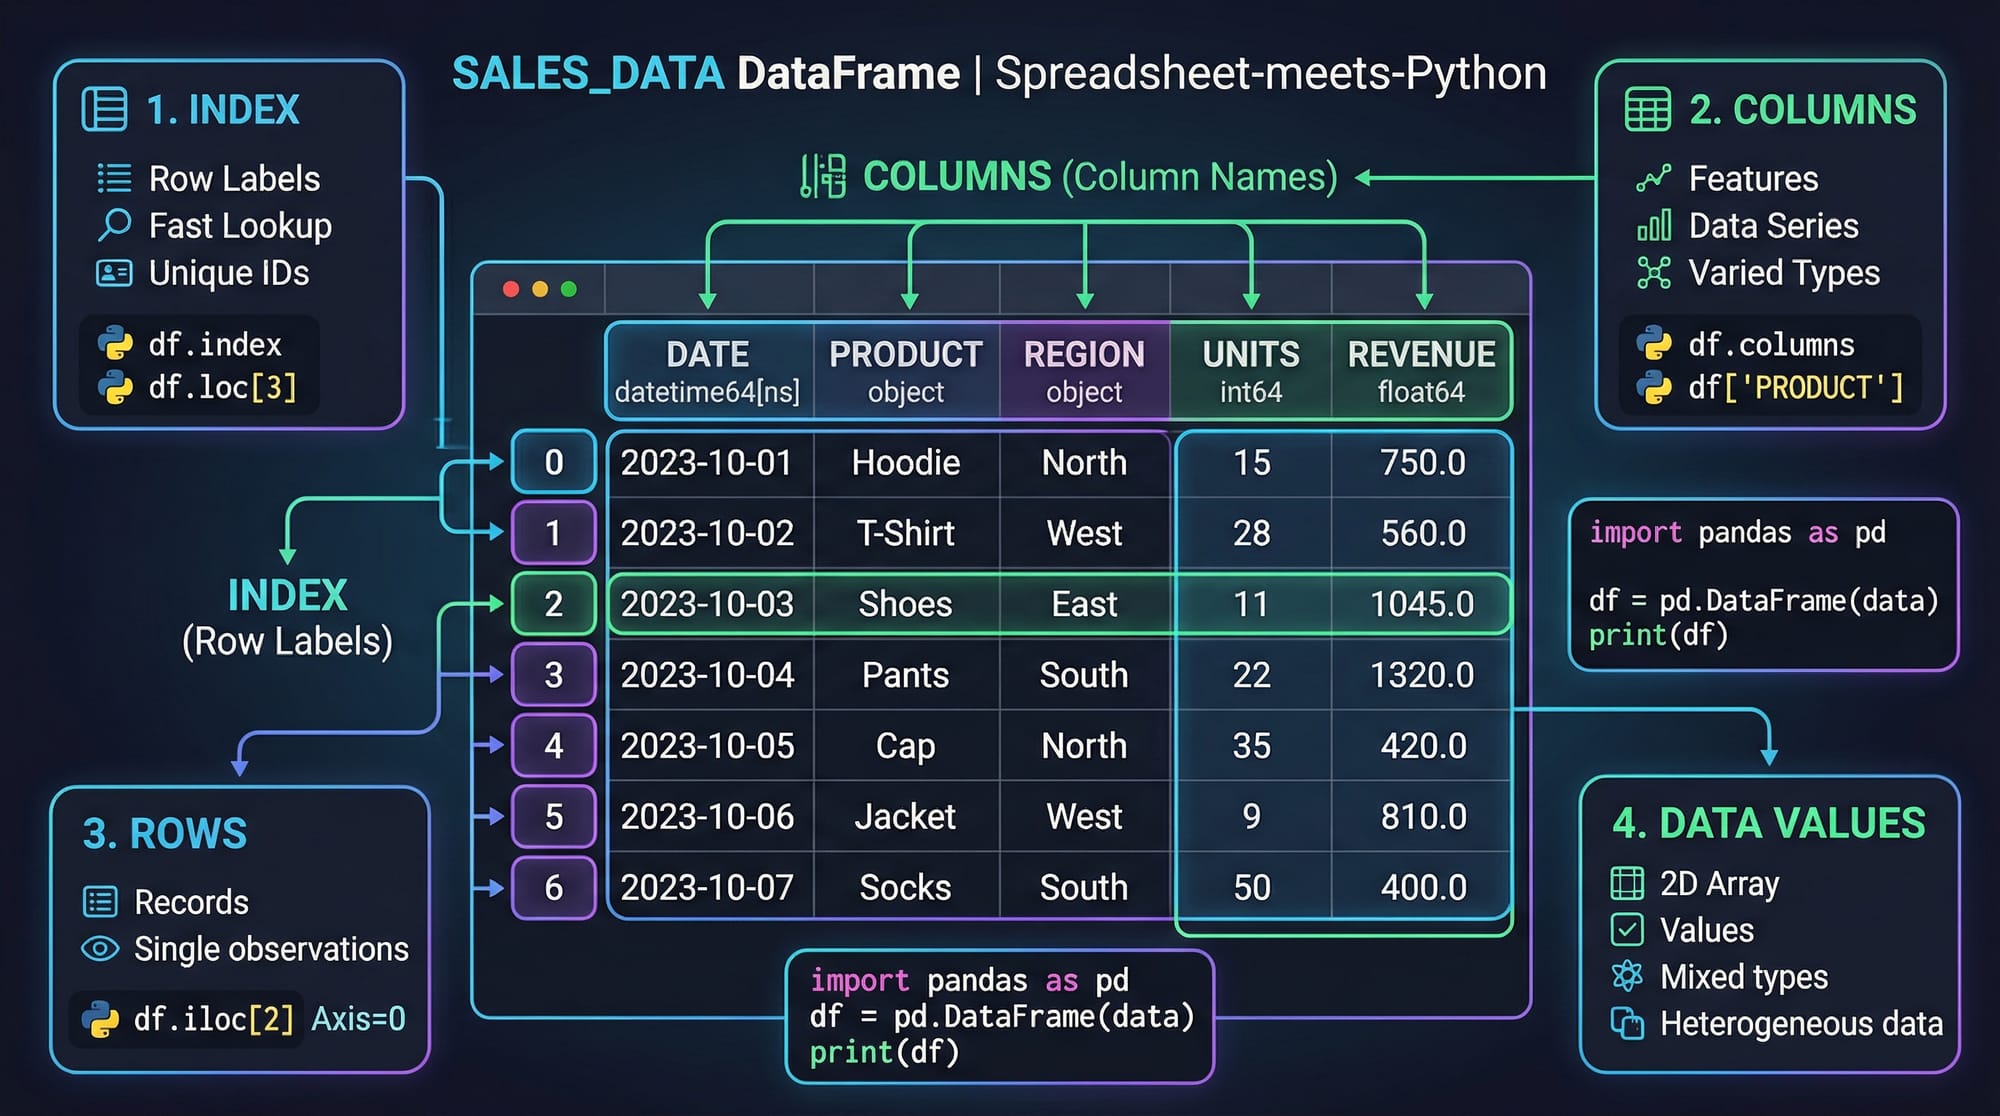
DataFrames & Series (The Foundation of Pandas)
In pandas, the two main data structures are:
Series → One-dimensional data (like a column)
DataFrame → Two-dimensional table (rows + columns)
Example:
import pandas as pd

data = {
    "Name": ["Ali", "Fatima", "Ahmad"],
    "Marks": [85, 90, 78]
}

df = pd.DataFrame(data)
print(df)
Explanation:
import pandas as pd→ Imports pandas librarydata→ Python dictionary containing student datapd.DataFrame(data)→ Converts dictionary into table formatprint(df)→ Displays the data
Output:
     Name  Marks
0     Ali     85
1  Fatima     90
2   Ahmad     78
Reading & Exploring Data
Pandas allows you to load data from CSV, Excel, databases, etc.
Example:
import pandas as pd

df = pd.read_csv("students.csv")
print(df.head())
Explanation:
pd.read_csv()→ Reads CSV file"students.csv"→ File namedf.head()→ Shows first 5 rows
Other useful functions:
df.info()→ Data types and structuredf.describe()→ Statistical summarydf.shape→ Number of rows and columns

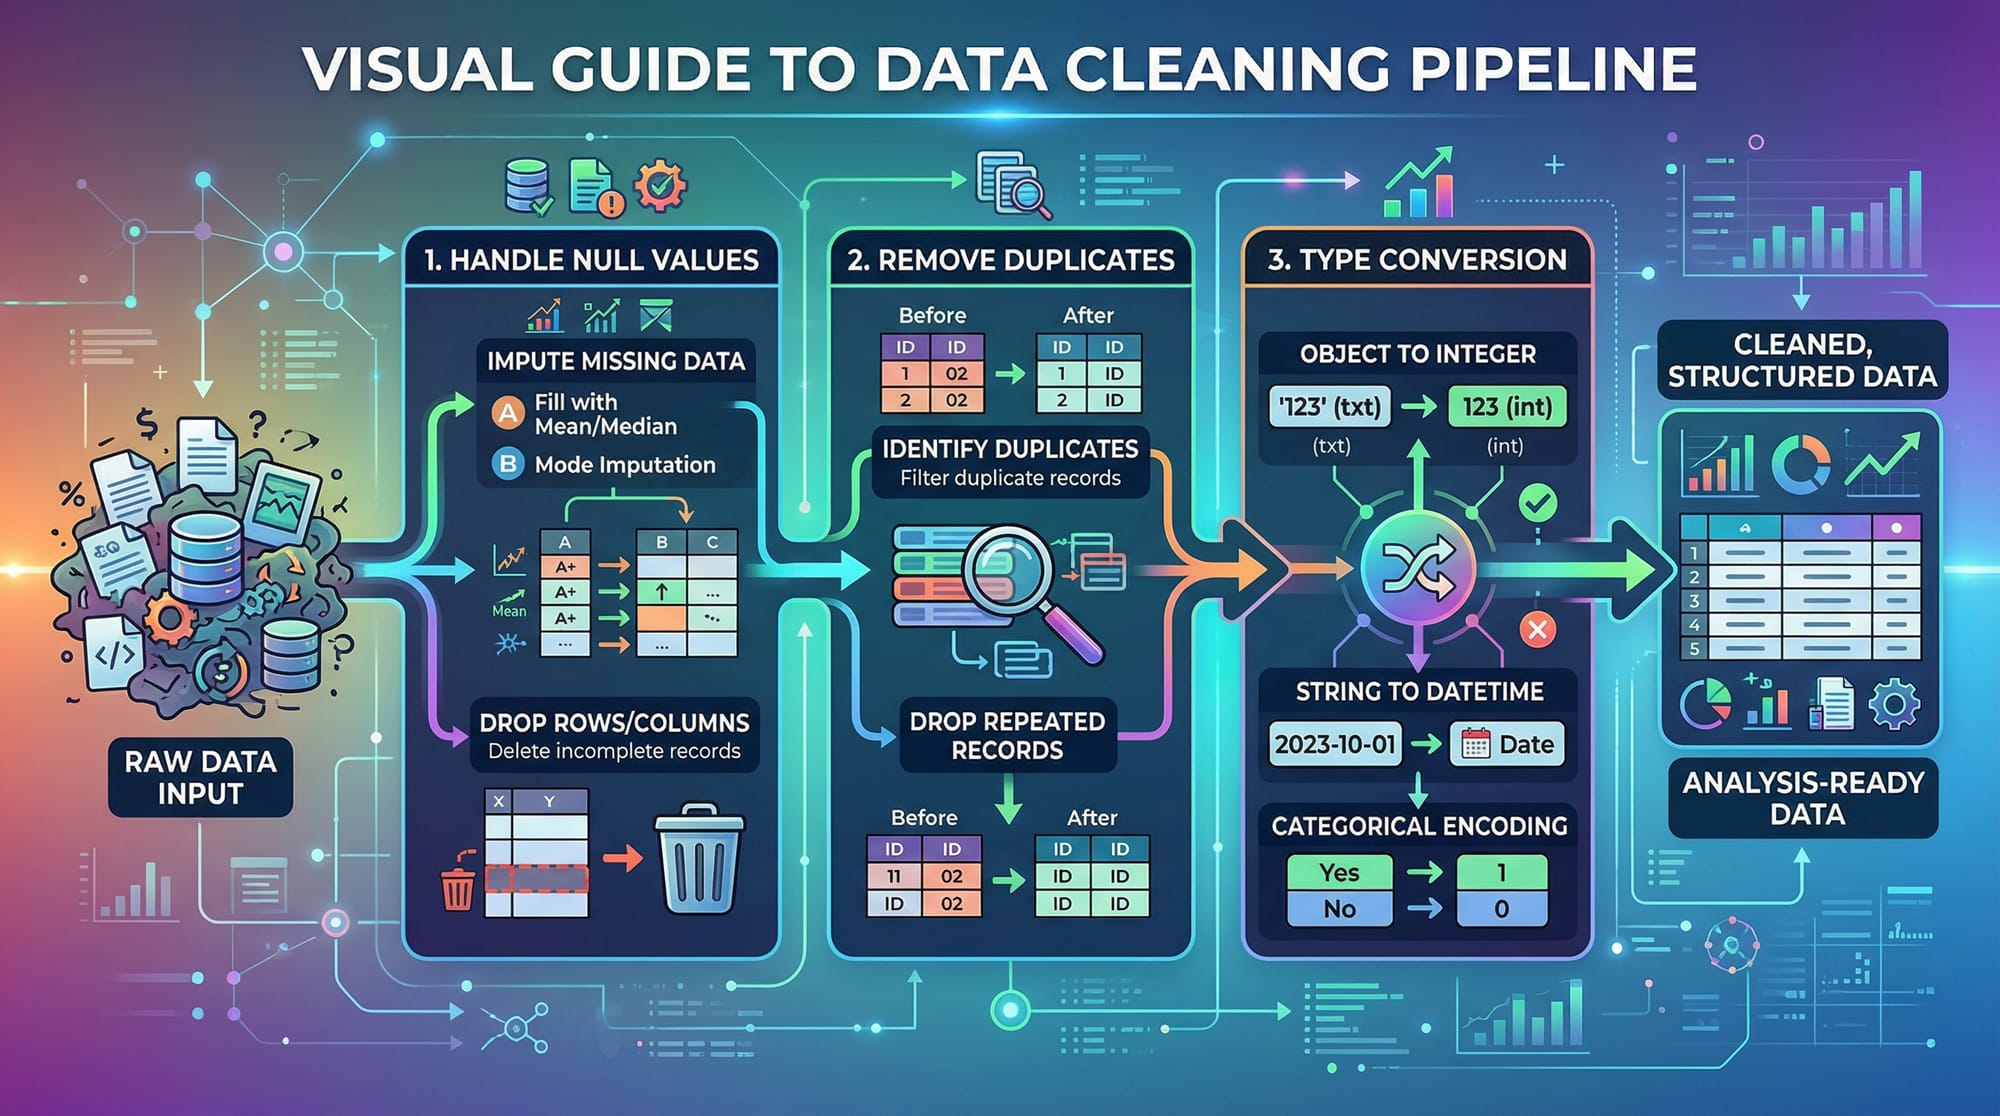
Data Cleaning & Manipulation
Real-world data is messy. Pandas helps clean it.
Handling Missing Values:
df = df.dropna()
- Removes rows with missing values
Filling Missing Values:
df["Marks"] = df["Marks"].fillna(0)
- Replaces missing values with 0
Renaming Columns:
df.rename(columns={"Marks": "Score"}, inplace=True)
- Changes column name
Filtering & Selection
high_scores = df[df["Marks"] > 80]
- Selects students with marks > 80
GroupBy Operations
df.groupby("City")["Marks"].mean()
- Groups data by city and calculates average marks
Merging DataFrames
merged = pd.merge(df1, df2, on="ID")
- Combines two tables using a common column
Practical Code Examples
Example 1: Student Result Analysis (Pakistan Context)
import pandas as pd

# Step 1: Create dataset
data = {
    "Name": ["Ali", "Fatima", "Ahmad", "Sara"],
    "City": ["Lahore", "Karachi", "Islamabad", "Lahore"],
    "Marks": [85, 92, 76, 88]
}

# Step 2: Convert to DataFrame
df = pd.DataFrame(data)

# Step 3: Show first rows
print(df.head())

# Step 4: Calculate average marks
avg = df["Marks"].mean()
print("Average Marks:", avg)

# Step 5: Filter top students
top_students = df[df["Marks"] > 85]
print(top_students)
Line-by-line Explanation:
data→ Dictionary storing student infopd.DataFrame(data)→ Converts data into tabledf.head()→ Displays first rowsdf["Marks"].mean()→ Calculates averagedf[df["Marks"] > 85]→ Filters top students
Example 2: Real-World Application (Sales Data in PKR)
import pandas as pd

# Step 1: Sales dataset
data = {
    "Product": ["Mobile", "Laptop", "Tablet", "Mobile"],
    "City": ["Karachi", "Lahore", "Islamabad", "Karachi"],
    "Sales": [50000, 120000, 30000, 70000]
}

# Step 2: Create DataFrame
df = pd.DataFrame(data)

# Step 3: Total sales per city
city_sales = df.groupby("City")["Sales"].sum()
print(city_sales)

# Step 4: Total sales per product
product_sales = df.groupby("Product")["Sales"].sum()
print(product_sales)
Explanation:
groupby("City")→ Groups sales by city.sum()→ Adds total sales- Useful for business analytics in Pakistan
Common Mistakes & How to Avoid Them
Mistake 1: Not Handling Missing Data
Problem:
df["Marks"].mean()
- Gives wrong result if missing values exist
Fix:
df["Marks"] = df["Marks"].fillna(df["Marks"].mean())
- Replaces missing values with average
Mistake 2: Forgetting inplace=True
Problem:
df.drop("Marks", axis=1)
- Does not modify original DataFrame
Fix:
df.drop("Marks", axis=1, inplace=True)
- Applies changes directly
Mistake 3: Wrong Column Names
Problem:
df["marks"]
- Error if actual column is
"Marks"
Fix:
print(df.columns)
- Check correct column names
Practice Exercises
Exercise 1: Filter High Salary Employees
Problem:
Create a DataFrame with employee names and salaries. Show employees earning more than 50,000 PKR.
Solution:
import pandas as pd

data = {
    "Name": ["Ali", "Sara", "Ahmad"],
    "Salary": [40000, 60000, 55000]
}

df = pd.DataFrame(data)

high_salary = df[df["Salary"] > 50000]
print(high_salary)
Explanation:
- Creates employee dataset
- Filters salary > 50,000
- Displays result
Exercise 2: Average Marks by City
Problem:
Find average marks of students grouped by city.
Solution:
import pandas as pd

data = {
    "City": ["Lahore", "Karachi", "Lahore"],
    "Marks": [80, 90, 70]
}

df = pd.DataFrame(data)

avg_marks = df.groupby("City")["Marks"].mean()
print(avg_marks)
Explanation:
- Groups data by city
- Calculates average marks
Frequently Asked Questions
What is pandas in Python?
Pandas is a Python library used for data analysis and manipulation. It provides powerful tools like DataFrames to handle structured data easily.
How do I install pandas?
You can install pandas using pip: pip install pandas. It works in Jupyter Notebook, VS Code, and other Python environments.
What is a DataFrame in pandas?
A DataFrame is a table-like structure with rows and columns. It is the most commonly used data structure in pandas for analyzing data.
How do I read a CSV file in pandas?
Use pd.read_csv("file.csv") to load a CSV file into a DataFrame. You can then explore it using functions like .head() and .info().
Why is pandas important for data science?
Pandas simplifies data cleaning, analysis, and transformation. It is widely used in real-world projects, making it essential for data science careers.
Summary & Key Takeaways
- Pandas is a powerful library for data analysis in Python
- DataFrames are the core structure used in pandas
- You can easily clean, filter, and manipulate data
- Functions like
groupby,merge, anddropnaare essential - Real-world applications include business analytics and student data analysis
- Mastering pandas opens doors to data science and freelancing opportunities
Next Steps & Related Tutorials
Now that you’ve completed this pandas dataframe guide, continue your learning with:
- Learn array operations in our NumPy Tutorial
- Strengthen basics with the Python Tutorial
- Explore data visualization using Matplotlib
- Dive into machine learning with Scikit-learn
These tutorials on theiqra.edu.pk will help you become a complete data science professional 🚀
Test Your Python Knowledge!
Finished reading? Take a quick quiz to see how much you've learned from this tutorial.